
Social media analytics is all about turning a mountain of raw user data into a clear roadmap that points straight to your business goals. It’s how you stop guessing and start making smart, predictable decisions backed by real numbers.
Why Social Media Analytics Is Your Navigator
Trying to run a social media campaign without analytics is like captaining a ship in a vast ocean with no compass, no charts, and no stars to guide you. You're certainly moving, but are you heading toward your destination or just sailing in circles? That feeling of motion without direction is exactly what analytics solves. It provides the essential instruments for your marketing journey.
This goes way beyond just counting likes and followers. True analytics is about understanding the why behind what your audience does, which is critical in today's crowded digital world. By 2025, there will be an estimated 5.45 billion people on social media, spending an average of 2 hours and 24 minutes scrolling every single day. They’re all there for different reasons—48.7% want to connect with friends, but 26.6% are actively looking for inspiration on what to buy. If you want to dive deeper into how user intent shapes marketing, you can review the latest social media statistics.
From Guesswork to Guided Strategy
Without analytics, your content strategy is built on pure guesswork. You might think your audience loves your flashy video content, but the data could show that your simple text-based posts are the ones actually driving website clicks and making you money. Analytics replaces those risky assumptions with cold, hard facts.
"Analytics isn’t about looking back; it’s about actively shaping the future of your marketing. It provides the proof needed to justify your strategies, secure budgets, and demonstrate real business impact."
By digging into this data, you start finding answers to the most important business questions:
- Which platforms deliver the most value? This tells you where to put your time and money for the best return.
- What type of content resonates most? You can stop wasting effort and create more of what actually works.
- What is the best time to post for maximum engagement? A simple tweak to your schedule can dramatically improve visibility.
This process transforms your social media presence from a simple broadcast channel into a smart, responsive marketing engine. To see how this works on a specific platform, check out this complete guide to Instagram analytics for business and see how data drives real growth.
The Four Pillars Of Social Media Metrics
Diving into social media analytics can feel like you've been handed a map written in a language you don't understand. With dozens of data points clamoring for your attention, it's easy to get lost. The secret is to stop looking at them as just numbers and start seeing them as a story.
To make sense of it all, we can group every metric into four core categories, or "pillars." Think of these pillars as the chapters that tell the story of your customer's journey with your brand. By reading them in order, you get the full narrative of your marketing impact, turning a confusing spreadsheet into a clear, actionable story.
To give you a bird's-eye view, here's a quick breakdown of how these pillars fit together.
The Four Pillars of Social Media Metrics
| Pillar | What It Measures | Key Metrics Examples |
|---|---|---|
| Awareness | How many people see your content. | Reach, Impressions, Audience Growth Rate |
| Engagement | How people interact with your content. | Likes, Comments, Shares, Saves |
| Conversion | How many people take a specific action. | Click-Through Rate (CTR), Leads, Sales |
| Advocacy | How many people promote your brand. | Brand Mentions, Customer Testimonials |
Each pillar builds on the last, giving you a complete picture of what's working and what isn't. Now, let's explore what each one really tells you.
Pillar 1: Awareness – Your First Handshake
This is the very top of your marketing funnel. It’s all about that first encounter where someone discovers your brand for the first time. Awareness metrics are simply about visibility and potential audience size. They answer one crucial question: "How many people are actually seeing our stuff?"
Two core metrics define this pillar:
- Reach: This is the total number of unique people who laid eyes on your content. If one person sees your post five times, their reach is still just one. It’s about the size of your audience.
- Impressions: This is the total number of times your content was displayed on a screen. That same person seeing your post five times now counts as five impressions. It’s about frequency.
Strong awareness numbers are a great sign that the platform's algorithm is on your side, but it’s just the first step. Seeing a post is one thing; caring about it is another entirely.
Pillar 2: Engagement – Starting the Conversation
Okay, so people have seen your post. Now what? Did they do anything? Engagement metrics tell you how your audience is interacting with your content. They're the proof that people aren't just endlessly scrolling past your brand.
You’re probably already familiar with these: likes, comments, shares, and saves. When your engagement rate (total engagements divided by reach) is high, it’s a clear signal that your content is hitting the mark and building a real connection. Think of it as the difference between someone hearing your name at a party versus them stopping to actually talk to you.
Pillar 3: Conversion – Getting Down to Business
This is where your social media efforts start to directly impact your bottom line. Conversion metrics track whether your audience took a valuable, specific action after seeing your content. This is the moment a follower starts turning into a customer. To truly measure what matters, it’s vital to identify the key social media metrics to track for your unique business goals.
A conversion is the ultimate proof that your social media strategy is driving real business value. It closes the loop between online chatter and results like revenue and new leads.
The most important conversion metrics include:
- Click-Through Rate (CTR): The percentage of people who not only saw your post but also clicked the link in it.
- Cost Per Conversion: Exactly how much you had to spend to get a single sale or lead from a campaign.
- Leads Generated: The raw number of new contacts you gained through a form fill or a download link.
A modern analytics dashboard can make these KPIs much easier to digest, as you can see here.
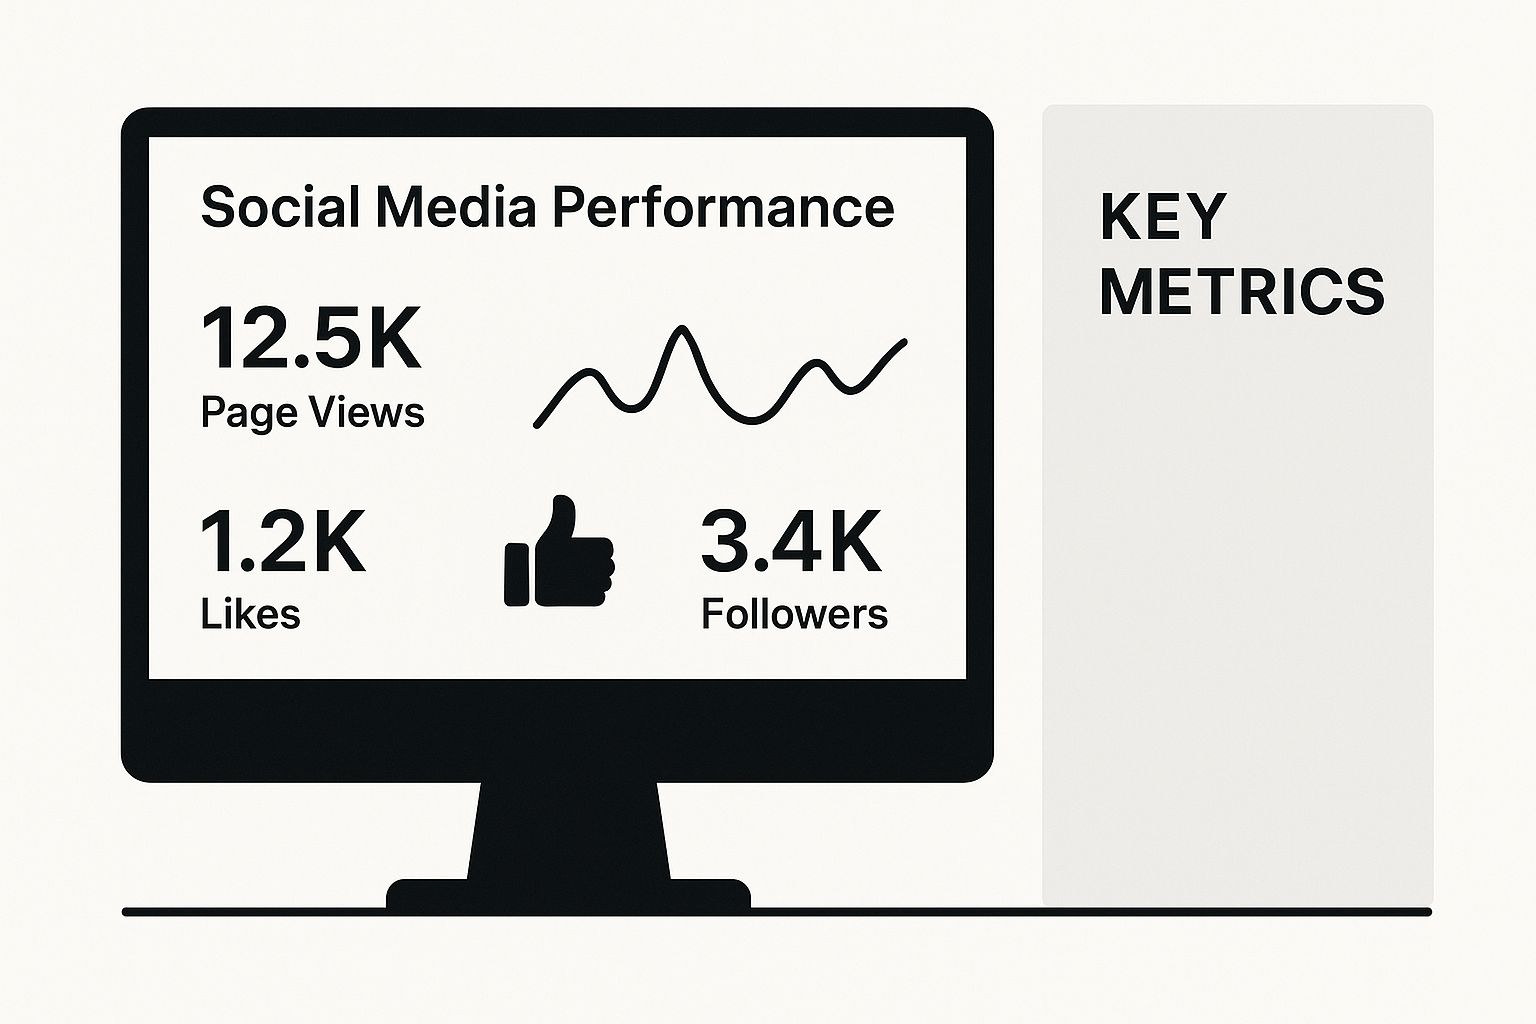
When you organize your data this way, you can spot patterns instantly and see which content is successfully guiding people from being passive viewers to active participants in your business.
Pillar 4: Advocacy – Creating Your Brand Champions
The final pillar, advocacy, is all about loyalty and genuine enthusiasm. These metrics measure how many people love your brand so much that they're willing to talk about it on their own, without any prompting. It’s the digital version of word-of-mouth, and it’s pure gold.
Look for metrics like brand mentions (both where you're tagged and where you aren't) and the use of your branded hashtags. When customers become advocates, they create an amazing feedback loop, generating authentic awareness and engagement that you could never pay for. They become your volunteer marketing team.
Build Your Actionable Analytics Dashboard
Alright, let's put all this theory into action. A truly useful social media analytics dashboard is a lot like the one in your car—it cuts through the clutter and shows you only the essential gauges you need to get where you're going safely and efficiently. It’s all about getting an at-a-glance view that helps you make smart decisions, not one that just buries you in numbers.
The first step, always, is to get crystal clear on your business goals. The "right" metrics are simply the ones that track what you actually care about achieving. If you’re trying to build brand awareness, then reach and impressions are your speedometers. If sales are the name of the game, then conversion rate is your fuel gauge.
Starting with Native Platform Tools
Every social media platform you use comes with its own set of free analytics tools. Think of Facebook Insights, Instagram Insights, and LinkedIn Analytics—they’re fantastic starting points. They don't cost a thing and give you a solid baseline for how you're doing on each channel.
For instance, Instagram Insights will tell you which Reels are getting people to stop scrolling and engage, while LinkedIn Analytics can reveal the professional demographics of your audience. These built-in tools are perfect for getting a feel for what resonates on each platform without spending a dime.
"A dashboard isn't just for reporting past events; it's a command center for making future decisions. Its job is to turn complex data into a simple question: 'What should we do next?'"
To really make these tools work for you, look for trends over time instead of getting hung up on daily spikes and dips. Are your engagement rates climbing month over month? Is your audience growing faster than it was last quarter? Those are the insights that truly matter. You can also dig deeper and learn how to improve your social media strategy with this kind of data.
Upgrading to a Centralized Dashboard
While native tools are a great starting point, bouncing between different tabs and platforms gets old fast. As your social media presence grows, you'll want to consolidate everything into a single, third-party dashboard. These tools pull all your data into one place, saving you a ton of time and, more importantly, helping you spot trends across all your channels.
A centralized dashboard lets you compare apples to apples. You can quickly see if video content works better on Facebook or YouTube, or if links to your blog posts get more clicks from LinkedIn versus X. This big-picture view is what helps you decide where to invest your time and budget.
When you're setting up your first custom dashboard, stick to the basics from each key area:
- Awareness: Total Reach and Audience Growth Rate
- Engagement: Overall Engagement Rate (combining likes, comments, and shares)
- Conversion: Click-Through Rate (CTR) and Cost Per Conversion
Starting with this simple framework cuts through the noise and gives you a powerful, immediate snapshot of how your entire social media ecosystem is performing.
Turn Data Into Strategic Decisions
Having a dashboard full of numbers is one thing. Knowing what to do with them is where the real magic happens. This is the moment your social media analytics stops being a simple report card and becomes your strategic playbook, connecting the dots between what the data says and what you do next.
Think of yourself as a detective. A high engagement rate is a clue, but it doesn't solve the case. You have to ask why. Are your funny memes pulling in tons of likes while your posts about new features are met with silence? That tells a story. It suggests your audience loves your brand's personality but isn't seeing a clear path from your content to their wallet.
From Numbers to Narratives
The trick is to view your data as feedback, not a final grade. Let's say your reach suddenly plummets, even though you haven't changed your posting schedule. It's a common headache for many of us. Instead of panicking, a data-first approach means you start investigating.
- Algorithm Changes: Did a platform just tweak its algorithm to favor a different content format, like pushing short-form video over images?
- Content Fatigue: Have you been posting the same style of content for so long that your audience is simply tuning you out?
- Competitor Activity: Did a rival just launch a huge campaign that’s sucking all the oxygen out of the room and grabbing your audience's attention?
Answering these questions turns a dip in performance into a valuable lesson. This is why context is everything. You can't just look at your numbers in a vacuum; you have to measure them against your own past campaigns, industry benchmarks, and what your competitors are up to.
Analytics isn't just about looking in the rearview mirror to see where you've been. It's about using that information to adjust the steering wheel and actively shape where your marketing is going.
Answering the Toughest Marketing Questions
Let’s walk through a classic scenario: your engagement is through the roof, but your conversion rates are flatlining. This points to a major disconnect in your customer journey. Your content is doing a fantastic job of grabbing attention (Awareness) and starting conversations (Engagement), but it’s failing when it comes to the final, crucial step: Conversion.
This is where you need to put on your strategist hat. The data is practically screaming at you to build a better bridge between engagement and action. You could experiment with stronger, more direct calls-to-action (CTAs), design landing pages that perfectly mirror the promise of your social posts, or even retarget those highly engaged users with direct product offers. Getting all this data organized is key, and you can learn how to structure your findings with a well-designed social media analytics report template.
This focus on data-driven action is no longer optional. With social media advertising spend projected to hit $276.7 billion in 2025, the pressure to prove a real return on investment is immense. This growth is fueled by algorithms that reward authentic, interactive content, making smart analytics the only way to cut through the noise. You can explore the latest social media statistics to see just how much the space is evolving.
Ultimately, turning data into decisions is what separates the brands that just exist on social media from those that truly thrive.
Prove Your Social Media ROI To Stakeholders

This is the moment every social media manager knows well. You've meticulously tracked your metrics, built stunning dashboards, and fine-tuned your content strategy. Now, you have to convince the people who sign the checks that your work is actually making the company money. This is where your social media analytics hit the bottom line.
Stakeholders and marketers often speak different languages. A huge spike in engagement is something you'd celebrate, but what they really want to see is a spike in qualified leads and sales. Your job is to be the translator—to connect your social media activities directly to real business outcomes. It’s all about proving that social media isn't just a line item expense; it's a powerful engine for profit.
If this challenge feels familiar, you're not alone. There's a well-documented disconnect: 65% of marketing leaders want to see a clear line from social campaigns to business goals, but only 30% of marketers feel they can confidently measure social media ROI. That's a massive gap, especially when you learn that 81% of consumers say they’ve made spontaneous purchases because of social media.
Calculating Your Social Media ROI
So, how do we actually build that bridge between social metrics and business results? It all starts with a simple, yet powerful, formula. At its heart, Return on Investment (ROI) is just a way of comparing what you gained to what you spent.
Social Media ROI (%) = (Net Profit from Social Media / Total Social Media Cost) x 100
To make this formula work, you need to pin down two numbers:
- Total Social Media Cost: This is the full picture of your investment. It includes ad spend, software subscriptions (like your scheduling tools), content creation expenses, and even the prorated salaries of your social media team.
- Net Profit: This is the revenue directly generated from your social efforts. You'll need to be diligent about tracking this with things like UTM parameters in your links, dedicated landing pages for campaigns, and conversion pixels.
Let's say you spent $1,000 on a campaign that brought in $4,000 in new sales. Your net profit is $3,000. Plug that into the formula, and your ROI is a fantastic 300%. Now that's a number any stakeholder can get excited about. For a deeper dive, check out our guide on how to measure social media ROI.
Presenting Your Findings
Once you have your ROI figured out, the final piece of the puzzle is presenting it in a way that tells a compelling story. Don't just drop a spreadsheet in their lap. You need to build a narrative that clearly connects your team's actions to the company's results.
Lead with the big, impressive ROI figure, then drill down into the details. Show them which platforms drove the best returns and which specific campaigns were the most profitable. Use clean visuals like charts and graphs to make the data easy to understand at a glance.
When you frame your social media analytics in the language of business—costs, profits, and returns—you’re not just sharing data. You're proving your value and making a rock-solid case for the resources you need to keep winning.
Common Questions About Social Media Analytics
https://www.youtube.com/embed/PP-rhZtESXk
Diving into social media analytics can sometimes feel like trying to decipher a secret code. Just when you think you've got the basics down, a tricky new question or a confusing situation pops up. This section is all about tackling those common hurdles head-on with straightforward, practical advice.
Think of this as your field guide for the real-world challenges every social media manager runs into. We’ll cover everything from what to do when your numbers suddenly tank to proving the value of a campaign that isn’t about making a direct sale. The goal is to give you the confidence to turn your data into smart decisions.
What Should I Do When My Metrics Suddenly Drop?
It’s a moment every marketer dreads. You log into your dashboard, and your reach or engagement has taken a nosedive. Before you hit the panic button, take a deep breath and channel your inner detective. A sudden drop is almost never random; it’s a clue pointing to something specific.
Start your investigation by looking at these usual suspects:
- Algorithm Changes: Platforms like Facebook and Instagram are always fiddling with their algorithms. An update might suddenly start prioritizing a different type of content—like short-form video—over what you’ve been posting.
- Content Fatigue: Let's be honest, are you stuck in a rut, posting the same kind of content over and over? Your audience might just be bored. A dip in your numbers is often a clear signal that it’s time to shake things up and get creative.
- Competitor Activity: Did a rival brand just launch a massive campaign or drop a viral video? Sometimes, a drop in your metrics isn't about something you did wrong, but about something a competitor is doing very right.
A sudden drop isn't a sign of failure—it's feedback. Use it as a wake-up call to re-evaluate your strategy, adapt, and come back stronger.
The best marketers don’t just watch their numbers; they react to them. Think of a sudden change in your data as a critical signal that it's time to pause, analyze, and adjust your course.
How Often Should I Check My Analytics?
There's a delicate balance between staying informed and becoming completely obsessed. If you check your metrics too often, you can fall into "analysis paralysis," overreacting to tiny daily blips and losing sight of the bigger picture. But if you check too infrequently, you risk missing major trends and opportunities to pivot.
For most people, this simple rhythm works best:
- Weekly Check-ins: Spend about 15 minutes once a week for a quick health check. This is perfect for spotting any big shifts, like a post that's blowing up or a sudden engagement drop that needs a closer look.
- Monthly Deep Dives: Block out an hour at the end of each month for a more serious review. This is when you zoom out to analyze broader trends, see how you performed against last month, and make strategic plans for the month ahead.
This two-tiered approach keeps you nimble enough to react to what's happening now, without getting lost in the noise.
How Do I Measure Awareness Campaign Success?
Not every social media campaign is built to drive immediate sales. Sometimes, the primary goal is just to get your name out there, build brand recognition, and start a conversation. So how do you prove an awareness campaign is working when you can't point to direct sales or leads?
It’s simple: you just shift your focus. Instead of looking at conversion metrics, you turn your attention to the Awareness and Engagement metrics we talked about earlier.
These become your new key performance indicators (KPIs) for success:
- Audience Growth Rate: Are new people joining your community? A steady increase in followers is a fantastic sign.
- Reach and Impressions: These fundamental metrics tell you exactly how many eyeballs are seeing your brand.
- Share of Voice: This advanced metric helps you understand how much of the conversation in your industry is about your brand versus your competitors.
- Video Views and View Completion Rate: If you’re using video, you don't just want people to see it—you want them to watch it. These metrics prove your content is compelling enough to hold their attention.
By tracking these KPIs, you can build a strong, data-backed case for your awareness efforts, proving their value even when there isn't a direct line to the bank.
Ready to stop manually posting and start focusing on the data that matters? EvergreenFeed automates your content schedule so you can spend less time posting and more time analyzing what works. Sign up for free today and put your social media on autopilot.