Unlocking Social Media Success in 2025: The Metrics That Matter
Want to maximize your social media impact? You need to understand which social media engagement metrics actually move the needle. This listicle reveals eight essential metrics to track in 2025. Learn how to analyze engagement rate, reach, impressions, click-through rate (CTR), conversion rate, share of voice (SOV), amplification rate, and video engagement metrics, plus how to use sentiment analysis. Mastering these social media engagement metrics will help optimize your strategy, understand your audience, and achieve your business objectives.
1. Engagement Rate
Engagement rate is a crucial social media engagement metric that measures the level of interaction your followers have with your content relative to your reach or follower count. Unlike vanity metrics like follower count, engagement rate provides a deeper understanding of how your audience truly connects with your brand. It typically includes actions like likes, comments, shares, and saves, divided by total followers or impressions, then multiplied by 100 to express it as a percentage. This metric reveals how resonant your content is, highlighting genuine audience interest beyond simply accumulating followers.
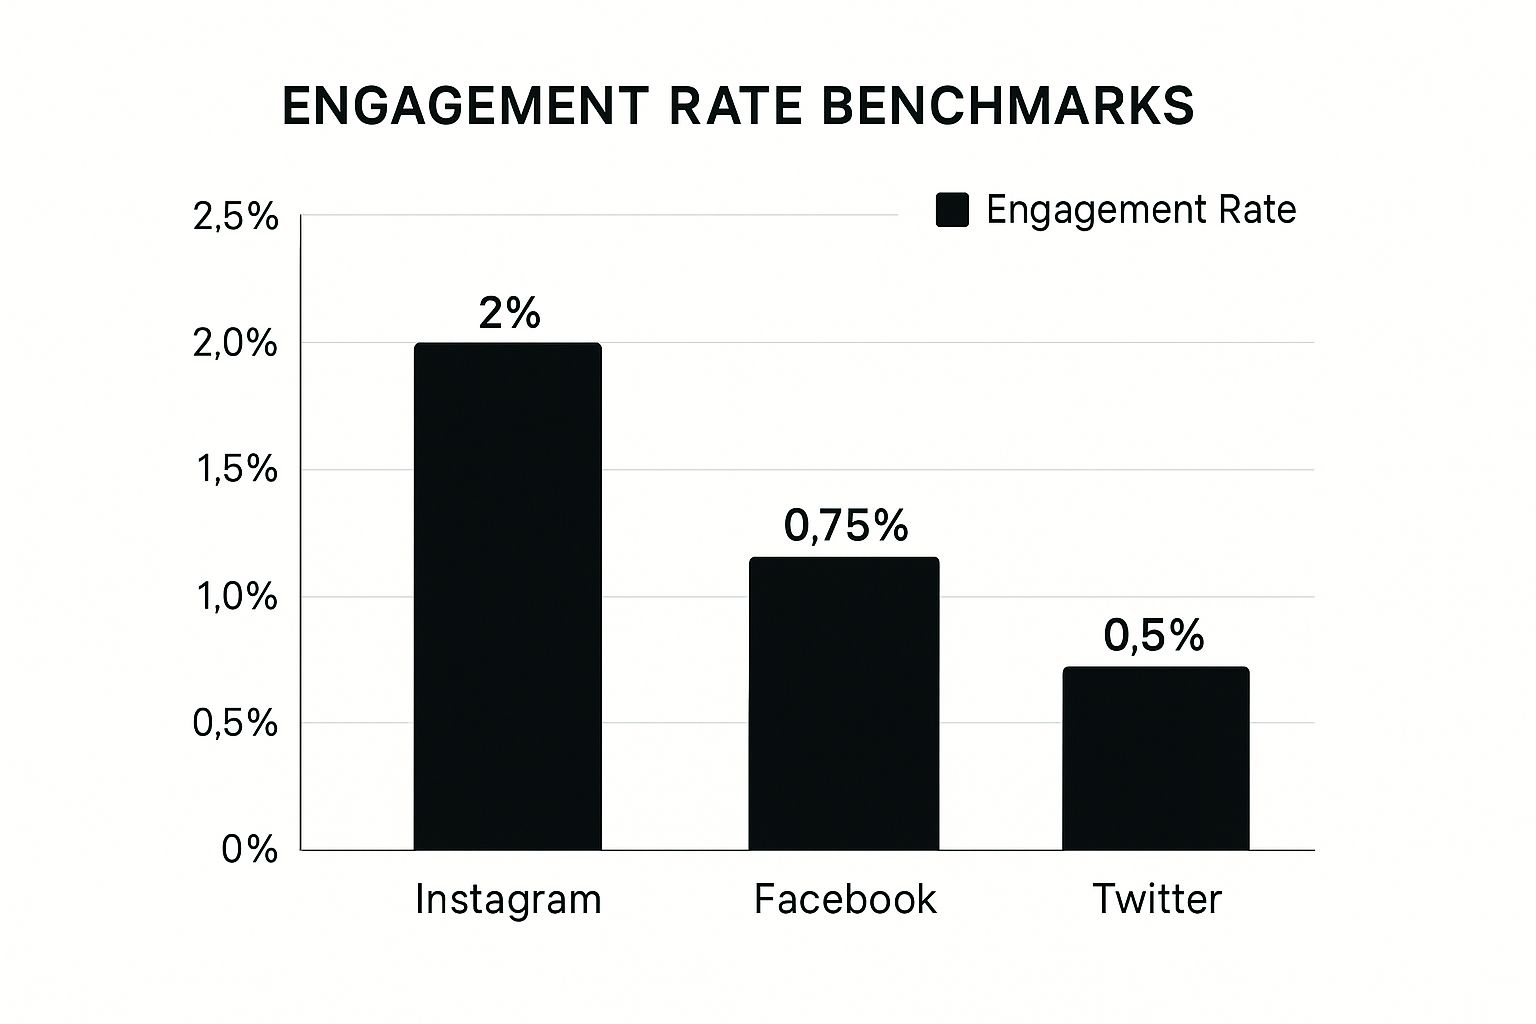
The infographic above visualizes average engagement rates across different social media platforms. As depicted in the bar chart, Instagram generally has lower engagement rates (around 1-3%) compared to platforms like Facebook (potentially reaching 4-5%) or Twitter (which can fluctuate but often falls between 1-2%). This highlights the importance of platform-specific strategies and benchmarking against industry averages rather than aiming for a universal engagement rate.
This metric encompasses multiple interaction types, providing a holistic view of audience activity. Whether a user likes, comments, shares, or saves your post, it contributes to your overall engagement rate. This rate is typically expressed as a percentage and can be calculated per post, averaged across campaigns, and segmented by platform (e.g., Instagram engagement rate vs. Twitter engagement rate), offering granular insights into performance.
Features and Benefits:
- Comprehensive Interaction Measurement: Includes likes, comments, shares, and saves.
- Percentage-Based: Easy to understand and compare.
- Granular Analysis: Can be calculated per post, campaign, or platform.
- Performance Indicator: Reveals content effectiveness and audience interest.
Pros:
- Meaningful Insights: More insightful than follower count alone.
- Content Optimization: Helps identify high-performing content types.
- Cross-Account Comparison: Facilitates comparisons between accounts of different sizes.
- Quality Indicator: Reflects content quality and audience resonance.
Cons:
- Varied Calculation: Calculation methods differ across platforms and agencies.
- Sentiment Blindness: Doesn't distinguish between positive and negative engagement.
- Potential for Inflation: Can be artificially inflated through engagement pods or paid engagement.
- Industry Variability: Average rates vary considerably by industry and platform.
Examples of Successful Implementation:
- National Geographic: Achieves 2-5% engagement rates on Instagram despite a massive follower base of over 250 million.
- GoPro: Maintains high engagement (3-4%) through user-generated content.
- Glossier: Focuses on authentic user content, resulting in a 4.5% average engagement rate across platforms.
Tips for Utilizing Engagement Rate:
- Benchmarking: Compare your engagement rate to industry averages.
- Trend Analysis: Track engagement rate trends over time, not just individual posts.
- Content Strategy: Analyze engagement rate differences across content types.
- Reach-Based Calculation: Consider calculating engagement rate by reach for a more accurate performance representation.
When and Why to Use Engagement Rate:
Use engagement rate as a primary social media engagement metric to assess the effectiveness of your social media strategy. It’s vital for understanding audience interaction, informing content creation, and measuring campaign success. Learn more about Engagement Rate. This metric is essential for social media managers, digital marketers, content creators, small business owners, and marketing agencies seeking to optimize their social media presence and achieve tangible results.
This metric deserves its place on any social media engagement metrics list because it provides a more nuanced and actionable measure of success than follower count alone. By focusing on engagement rate, you can gain a clearer picture of how your audience interacts with your brand and refine your strategy accordingly. This focus on true engagement contributes to a more meaningful and impactful social media presence. Engagement rate is a key performance indicator (KPI) for understanding what resonates with your target audience and is a crucial component of effective social media management for any business or individual looking to build a strong online presence.
2. Reach and Impressions
Reach and impressions are two fundamental social media engagement metrics that provide valuable insights into the visibility and potential impact of your content. Understanding the difference between these two metrics, and how to leverage them, is crucial for any successful social media strategy. These metrics deserve a prominent place on this list because they offer a foundational understanding of how many people are seeing your content, laying the groundwork for analyzing more nuanced engagement metrics.
What are Reach and Impressions?
Reach measures the unique number of users who have seen your content. Each user is counted only once, regardless of how many times they've seen the post. Impressions, on the other hand, measure the total number of times your content was displayed, including repeat views by the same user. Think of it this way: if one person sees your post three times, that's one reach and three impressions.
Features:
- Unique vs. Total: Reach counts unique viewers, while impressions count total views.
- Multiplier Effect: Impressions can often be significantly higher than reach.
- Time-Based Tracking: Typically tracked daily, weekly, or monthly.
- Performance Breakdown: Can be segmented by organic (unpaid) vs. paid reach and impressions.
Why Use Reach and Impressions?
Together, reach and impressions paint a picture of both the breadth and frequency of your content's exposure. This information is essential for:
- Understanding Content Visibility: Go beyond your follower count and see how many people your content is actually reaching.
- Identifying Viral Potential: High reach relative to your follower count suggests your content is resonating beyond your existing audience.
- Evaluating Algorithm Performance: Changes in reach can indicate how algorithm updates are affecting your content's visibility.
- Calculating Other Metrics: Reach is crucial for calculating other important metrics like engagement rate by reach, providing a more accurate measure of engagement than using follower count.
Pros:
- Provides clear visibility into content exposure beyond just followers.
- Helps identify content with viral potential.
- Useful for evaluating algorithm performance.
- Critical for calculating other metrics like engagement rate by reach.
Cons:
- Viewership doesn't guarantee meaningful engagement (someone might see your post but not interact with it).
- Subject to algorithm changes that can cause dramatic fluctuations in reach.
- Can be misleading if content is seen but scrolled past quickly (low dwell time).
- Difficult to track consistently across all platforms, as each platform has its own methodology.
Examples of Successful Implementation:
- Wendy's: Their Twitter campaigns regularly achieve reach 5-10x their follower count through witty and viral responses, demonstrating the power of engaging content.
- Red Bull: Their extreme sports content typically reaches 30-40% of their follower base organically on Instagram, leveraging high-quality visuals and targeted hashtags.
- The New York Times: Achieves a reach-to-follower ratio of nearly 2:1 on Facebook through high shareability, highlighting the importance of newsworthy and easily shareable content.
Actionable Tips for Using Reach and Impressions:
- Compare Reach to Follower Count: Assess your content's ability to break out of your existing audience. A high reach-to-follower ratio indicates strong organic performance.
- Track Impressions-to-Reach Ratio: Understand how often users revisit your content. A higher ratio suggests repeat viewership.
- Identify Optimal Posting Times: Use reach metrics to pinpoint when your audience is most active on each platform.
- Create Content-Specific Benchmarks: Establish separate benchmarks for different content categories (e.g., product posts vs. educational content).
Popularized By:
- Facebook Insights and Instagram Insights: Native analytics platforms providing detailed reach and impression data.
- Google Analytics: For tracking website content reach via social media referrals.
- Twitter Analytics: Provides tweet reach and impression statistics.
By effectively tracking and analyzing reach and impressions, social media managers and marketers can gain valuable insights into content performance, optimize their strategies, and ultimately achieve their social media goals. This crucial understanding of content visibility is essential for maximizing engagement and growing your audience.
3. Click-Through Rate (CTR)
Click-Through Rate (CTR) is a crucial social media engagement metric that measures the percentage of people who click on a link or call-to-action within your social media content after seeing it. It provides valuable insight into how effectively your content is driving traffic to your desired destinations, such as websites, landing pages, or product pages. Calculated by dividing the number of clicks by the number of impressions and then multiplying by 100, CTR is a direct measure of audience action beyond passive engagement like likes or comments. This metric is typically expressed as a percentage and can be tracked per post or across entire campaigns, making it a versatile tool for analyzing social media performance. It's particularly important in paid social advertising, where it serves as a key performance indicator (KPI) for evaluating campaign effectiveness.
CTR deserves its place on the list of essential social media engagement metrics because it directly ties social media efforts to tangible business outcomes. While other metrics like likes and shares can indicate audience interest, CTR offers a more concrete measure of how effectively your content is driving traffic and potential conversions. Its focus on actionable audience behavior makes it particularly valuable for revenue-focused businesses. Key features of CTR include its direct measurement of action, percentage-based expression, trackability across posts and campaigns, and its prominent role in paid social advertising.
Pros:
- Strong indicator of content relevance and call-to-action effectiveness: A high CTR suggests that your content resonates with your audience and that your call-to-action is compelling.
- Directly ties social media efforts to website traffic and conversion potential: CTR provides a clear link between social media activity and website performance, helping you understand the impact of your social strategy.
- More actionable than engagement metrics for revenue-focused businesses: For businesses focused on driving sales or leads, CTR offers a more direct measure of success than vanity metrics.
- Helps identify which types of offers or content formats drive the most action: Analyzing CTR across different content types can reveal what resonates most with your audience and inform future content creation.
Cons:
- Can be affected by technical issues: Slow loading times or broken links can negatively impact CTR, even if your content is engaging.
- Doesn't account for post-click behavior: CTR doesn't tell you what happens after the click, such as bounce rate or conversion rate.
- Often lower than other engagement metrics: CTR is typically lower than metrics like likes or comments, which can be discouraging if viewed in isolation.
- Platform algorithms can limit organic link reach: Social media platforms may prioritize content without external links, potentially requiring paid promotion to achieve significant organic reach.
Examples of Successful Implementation:
- Shopify: Educational Instagram posts linking to their resource center achieve 3-4% CTR.
- BuzzFeed: Curiosity-gap headlines regularly generate 5-7% CTR on Twitter.
- Airbnb: Destination showcase posts on Facebook achieve CTRs of 2-3%, well above industry average.
Tips for Improving CTR:
- Use strong, clear calls-to-action: Clearly communicate the value proposition of clicking and guide users towards the desired action.
- Test different link placements: Experiment with placing links in captions, stories, bios, and other locations to optimize for maximum visibility and clicks.
- Segment CTR analysis by content type: Identify which types of content drive the most clicks to inform your content strategy.
- Consider the user journey after the click: Optimize the landing page experience to ensure a seamless transition and encourage conversions.
- Use URL parameters or UTM codes: Track social clicks accurately in your analytics platform to gain deeper insights into campaign performance.
Popularized By:
Digital advertising platforms like Google Ads, email marketing services that later applied these metrics to social media, and social advertising tools like Facebook Ads Manager have all contributed to the widespread use and understanding of CTR.
4. Conversion Rate
Conversion rate is a crucial social media engagement metric that goes beyond vanity metrics like likes and shares, focusing on tangible business outcomes. It measures the percentage of social media users who complete a desired action after clicking through from your social content. This action could be anything from making a purchase and signing up for a newsletter to downloading a resource or submitting a form. By tracking conversion rates, you gain valuable insights into how effectively your social media activities are translating into meaningful results. This metric directly connects social media activity to business outcomes, demonstrating the value of your social media marketing efforts. This makes it a vital metric for justifying budget allocation and demonstrating ROI to stakeholders.
How it Works:
Conversion rate is calculated by dividing the number of conversions attributed to social media by the total number of clicks from social media, then multiplying by 100 to express it as a percentage. For example, if 100 people click on a link in your Instagram post and 5 of them make a purchase, your conversion rate for that post is 5%.
Examples of Successful Implementation:
- E-commerce: Fashion retailer ASOS leverages Instagram Shopping posts to achieve conversion rates of 2-3%, directly linking product discovery to purchase.
- Lead Generation: HubSpot uses LinkedIn content to drive traffic to lead capture forms, achieving conversion rates of 5-7%.
- App Downloads: The meditation app Calm converts 4% of Twitter traffic to free trial sign-ups, demonstrating the effectiveness of social media for user acquisition.
Why Use Conversion Rate?
Conversion rate offers a clear picture of how effectively your social media strategy is contributing to your business objectives. It's a key performance indicator (KPI) for demonstrating the return on investment (ROI) of your social media marketing spend. Tracking conversion rates helps you understand which social platforms are driving not just traffic, but valuable traffic that leads to desired actions. This knowledge allows for more strategic allocation of resources and optimization of campaigns.
Pros:
- Directly ties social media efforts to ROI and business impact.
- Helps justify social media marketing budgets to stakeholders.
- Identifies which platforms drive valuable traffic.
- Enables more sophisticated attribution modeling.
Cons:
- Requires proper tracking setup and technical implementation (e.g., UTM parameters, analytics integration).
- Social media is often an awareness channel, making accurate conversion attribution challenging.
- Multiple touchpoints may influence conversions, making it difficult to solely credit social media.
- Privacy changes (like iOS updates) have impacted the accuracy and availability of conversion tracking data.
Actionable Tips:
- Implement UTM Parameters: Use UTM parameters in your social media links to accurately track the source of your website traffic and attribute conversions to specific campaigns and platforms.
- Set Up Conversion Funnels: Use analytics platforms like Google Analytics to create conversion funnels and identify drop-off points in the user journey. This helps pinpoint areas for improvement in the conversion process.
- Cross-Platform Comparison: Compare conversion rates across different social media platforms to identify your best-performing channels and focus your efforts accordingly.
- Landing Page Optimization: Test different landing page experiences tailored to social media traffic to improve conversion rates.
- Consider Attribution Windows: Recognize that social media conversions may have longer consideration periods. Adjust your attribution window to accurately capture the influence of social media throughout the customer journey.
Popularized By:
Conversion rate tracking is a standard feature of various platforms, including e-commerce platforms like Shopify and WooCommerce, analytics platforms like Google Analytics, and CRM systems like Salesforce that connect marketing efforts to sales outcomes.
This metric deserves its place in the list of essential social media engagement metrics because it shifts the focus from vanity metrics to tangible business results. By understanding and optimizing your conversion rate, you can ensure that your social media efforts are directly contributing to your overall business goals and driving meaningful growth.
5. Share of Voice (SOV)
Share of Voice (SOV) is a crucial social media engagement metric that provides invaluable competitive insights. Unlike other metrics that focus solely on your brand's performance, SOV measures your visibility and share of conversations relative to your competitors. It essentially quantifies what percentage of the overall industry discussion on social media is about your brand compared to others in your market space. This allows you to gauge your brand awareness, competitive standing, and overall dominance within the social media landscape. Understanding SOV is essential for any business looking to maximize the impact of its social media efforts and truly understand its market position. This metric earns its place on this list of essential social media engagement metrics because it provides the competitive context often lacking in other measurements.
How Does SOV Work?
SOV is calculated as a percentage of the total industry mentions on social media. It's not just about the number of mentions, but the proportion of conversations related to your brand versus your competitors. For example, if there are 10,000 total social media mentions about athletic shoes, and 1,000 of those mentions are about your brand, your SOV is 10%. This comparative analysis gives a clear picture of how much of the social media "buzz" surrounds your brand compared to the competition.
SOV can be measured based on several factors:
- Volume: The raw number of mentions for each brand.
- Reach: The potential audience exposed to mentions of each brand.
- Engagement: The level of interaction (likes, shares, comments) with mentions of each brand.
Furthermore, SOV can be broken down by sentiment (positive, negative, or neutral) to provide a more nuanced understanding of brand perception.
Examples of Successful SOV Implementation:
- Wendy's: Their bold and often humorous Twitter strategy dramatically increased their SOV within the fast-food industry, surpassing competitors with significantly more physical locations. This demonstrated how effective content can elevate SOV even with fewer resources.
- Target: Through strategic influencer partnerships during the 2020 holiday season, Target achieved a remarkable SOV among retailers, demonstrating the power of influencer collaborations in boosting brand visibility.
- Fenty Beauty: By emphasizing inclusivity, Fenty Beauty quickly captured a substantial SOV in the beauty industry within months of its launch, showcasing how a strong brand message can resonate with audiences and dominate online conversations.
Actionable Tips for Using SOV:
- Track SOV Before, During, and After Campaigns: This helps measure the impact of your social media marketing activities and demonstrates ROI.
- Set Up Alerts: Be notified of significant SOV changes, which might indicate competitor actions or shifting market dynamics.
- Segment by Platform: Identify where you're strongest and weakest compared to competitors, allowing for targeted platform strategies.
- Analyze Conversation Drivers: Understand the topics and themes driving SOV to inform content creation and engagement strategies.
- Consider Weighted SOV: Account for mention sentiment and engagement to gain a more accurate representation of brand perception.
Pros and Cons of Using SOV:
Pros:
- Competitive Context: Offers insights into market positioning and competitor activity.
- Market Perception: Helps understand how your brand is perceived relative to competitors.
- Early Warning System: Can signal emerging competitors or changing market dynamics.
- Realistic Goal Setting: Enables the development of data-driven growth targets.
Cons:
- Requires Specialized Tools: Accurate SOV measurement necessitates sophisticated social listening platforms.
- Raw Volume Can Be Misleading: Doesn't always reflect the quality or sentiment of engagement.
- Susceptible to Skewing: Negative PR events can artificially inflate mention volume.
- Difficult to Track in Niche Industries: Industries with limited social conversation can make SOV analysis challenging.
Popularized By: Social listening platforms like Brandwatch and Sprinklr, PR measurement firms such as Cision and Meltwater, and marketing agencies specializing in competitive analysis frameworks.
By understanding and tracking Share of Voice, social media managers, digital marketers, and business owners can gain invaluable insights into their competitive landscape, refine their social media strategies, and effectively measure their progress towards dominating the online conversation.
6. Amplification Rate
Amplification rate is a crucial social media engagement metric that measures how often your followers share your content with their networks, effectively extending your reach beyond your immediate audience. This metric goes beyond simple likes or comments, focusing specifically on the sharing behavior that fuels organic growth and virality. It's calculated by dividing the number of shares (retweets, reposts, shares, etc.) by the total number of posts. This provides valuable insight into which content resonates most deeply with your audience and has the potential to go viral.
Amplification rate deserves a prominent place in any social media engagement analysis because it’s a powerful indicator of content quality and audience endorsement. Unlike likes, which can be fleeting and superficial, shares signify a conscious decision by a follower to advocate for your brand and content within their own social circles. This organic reach often leads to higher-quality traffic than paid promotion, as it comes with the implicit endorsement of a trusted connection. For example, TED's educational content consistently achieves amplification rates of 8-10% on LinkedIn, demonstrating the platform's appetite for valuable, shareable insights. Similarly, Oreo's culturally relevant tweets often see amplification rates of 15-20%, highlighting the power of timely and engaging content. The Economist has also found that their data visualizations get shared 3-4x more than their standard content, illustrating the impact of content format on shareability.
One of the key features of amplification rate is its platform-specific terminology. A "retweet" on Twitter signifies something different than a "share" on Facebook or a "repin" on Pinterest. Understanding these nuances is crucial for accurate measurement and analysis. While amplification rate is a powerful metric, it’s important to be aware of its limitations. It typically has a lower volume than likes or comments, making it harder to measure consistently, especially for accounts with smaller followings. Also, amplification rates can vary significantly based on platform culture and sharing mechanisms. For example, visually-driven platforms like Instagram might naturally see higher share rates compared to text-heavy platforms like Twitter. Finally, contests or incentivized sharing can artificially inflate amplification rates, providing a skewed perspective of true organic reach. It's also important to note that amplification rate doesn't account for private shares (e.g., direct messages) which aren't publicly trackable.
To effectively leverage amplification rate as a social media engagement metric, consider the following tips: create content that provides clear utility, evokes an emotional impact, or offers entertainment value. Use social listening to identify trending topics and create timely content that resonates with current conversations. Analyze your highest-amplified content to identify common characteristics and replicate successful strategies. Test different content formats (videos, infographics, quotes) to understand what resonates best with your audience. Consider timing your content releases around relevant events or conversations to maximize shareability. Need some fresh ideas? Learn more about Amplification Rate and brainstorming for social media.
The importance of “shareable” vs. “likeable” content, as emphasized by content marketing strategist Jay Baer, has greatly influenced how we understand amplification rate. This concept, combined with Avinash Kaushik's digital marketing measurement frameworks and tools like BuzzSumo’s content analysis platform, has solidified amplification rate’s position as a key social media engagement metric. By focusing on content that encourages sharing, you can extend your brand's reach, drive organic growth, and build stronger connections with your target audience.
7. Video Engagement Metrics
Video engagement metrics are crucial social media engagement metrics for anyone serious about understanding their video content's performance. They move beyond vanity metrics like simple view counts to provide a much richer understanding of how users actually interact with your videos. This makes them essential for social media managers, digital marketers, content creators, and anyone leveraging video in their social media strategy.
Instead of just knowing how many people saw your video, video engagement metrics reveal how much they watched and how engaged they were. These metrics include:
- View Count: While seemingly basic, understanding the platform-specific definition of a "view" is crucial. A view might be registered after just 3 seconds on Facebook, but requires 30 seconds on YouTube. This variance highlights the need to understand each platform's nuances.
- Watch Time: This measures the total accumulated minutes viewed across all viewers. A high watch time suggests compelling content that keeps viewers hooked.
- Retention Rate: This metric shows the percentage of viewers who remained at each point throughout the video. Dips in retention can pinpoint areas needing improvement.
- Completion Rate: This indicates the percentage of viewers who watched the video to the very end. High completion rates often correlate with satisfying narratives and effective calls to action.
Why Video Engagement Metrics Matter
Video is increasingly dominant on social media. Platforms like Facebook, YouTube, and TikTok prioritize video content, making understanding these metrics even more critical. By analyzing these metrics, you can optimize your video strategy, improve content quality, and ultimately drive better results. For example, if you're trying to Learn more about Video Engagement Metrics for YouTube marketing, understanding watch time and retention is key for algorithm optimization.
Pros of Tracking Video Engagement Metrics:
- Provides deeper insight into content performance than view counts alone.
- Helps identify the optimal video length and content structure.
- Pinpoints where viewers drop off or re-engage.
- Essential for success on platforms prioritizing video.
Cons of Tracking Video Engagement Metrics:
- Metric definitions vary significantly across platforms.
- Autoplay can inflate view counts.
- Longer videos naturally have lower completion rates.
- Requires more sophisticated analysis than static content metrics.
Examples of Successful Implementation:
- Tasty: Their top-down recipe videos maintain high average completion rates (around 65%) by keeping videos concise, often under 60 seconds.
- GoPro: They achieve strong retention (40-50%) at the 2-minute mark by opening with high-action sequences that immediately grab attention.
- TikTok: Best-performing brand videos often achieve completion rates of 85% or higher by building suspense that resolves at the end.
Actionable Tips for Leveraging Video Engagement Metrics:
- Front-load key messages: Capture attention in the first 5-10 seconds to combat early viewer drop-off.
- Analyze retention graphs: Identify specific points where viewers lose interest and revise those sections.
- Experiment with video lengths: Find the sweet spot for your audience's attention span.
- Use captions: Improve accessibility and retention for viewers watching without sound.
- Create compelling thumbnails: Accurately represent video content to set proper expectations and encourage clicks.
The Rise of Video Engagement Metrics:
The importance of video engagement metrics has been driven by platforms like YouTube Studio, which pioneered detailed video performance analysis. Facebook's shift towards video around 2016-2017 and TikTok's algorithm, which heavily prioritizes completion rate, further cemented the importance of these metrics.
By understanding and utilizing video engagement metrics, you can create more effective video content that resonates with your audience, boosts engagement, and achieves your social media goals.
8. Sentiment Analysis
Sentiment analysis is a crucial social media engagement metric that moves beyond simply counting likes and shares to understand the emotional tone behind online conversations about your brand. It deserves its place on this list because it provides critical context to raw engagement numbers, allowing you to gauge the true impact of your social media efforts. Essentially, it helps you understand not just how much people are talking about your brand, but how they feel about it. This valuable insight can inform strategic decision-making across various departments, from marketing and PR to customer service and product development.
How it Works:
Sentiment analysis leverages the power of natural language processing (NLP) and machine learning to automatically evaluate text data from social media mentions, comments, reviews, and other online interactions. These advanced technologies analyze the language used and categorize each mention as positive, negative, or neutral. More sophisticated tools can even delve into sub-categories of emotions like joy, anger, disappointment, and excitement. Some tools also incorporate emoji analysis to provide a more comprehensive understanding of sentiment. This process provides a percentage breakdown of overall sentiment, allowing you to track shifts in public opinion over time or in response to specific events or campaigns.
Features and Benefits:
- Categorization: Typically categorizes mentions as positive, negative, or neutral with percentage breakdowns.
- Trend Tracking: Can track sentiment changes over time or around specific events, allowing for real-time monitoring and reactive strategies.
- Granular Insights: Often includes sub-categories of emotions, providing a nuanced view beyond simple positive/negative classifications.
- Emoji Analysis: May incorporate emoji analysis alongside text, capturing emotional cues often missed by text-based analysis.
- Competitive Advantage: Offers useful competitive comparisons beyond volume metrics, revealing audience sentiment towards competitors.
Pros:
- Provides essential context to raw engagement numbers, revealing the "why" behind the "what".
- Helps identify potential PR crises and customer service issues before they escalate, enabling proactive intervention.
- Offers valuable insight into emotional connections with audiences, facilitating the development of more resonant content.
- Useful for benchmarking against competitors, understanding market positioning, and identifying areas for improvement.
Cons:
- Nuance and Sarcasm: Automated sentiment analysis can struggle with sarcasm, humor, and cultural nuances, leading to misinterpretations.
- Cost: Sophisticated sentiment analysis tools can be expensive, potentially posing a barrier for smaller businesses.
- Accuracy: Often requires human review to verify accuracy, especially for complex or sensitive topics.
- Vocal Minorities: Sentiment can be skewed by vocal minorities, potentially misrepresenting the overall public opinion.
Examples of Successful Implementation:
- Peloton: After their controversial 2019 holiday ad, sentiment analysis revealed a rapid shift from predominantly positive to largely negative within 48 hours, highlighting the immediate impact of the controversy.
- Airbnb: During the COVID-19 pandemic, Airbnb's community support initiatives significantly improved their sentiment scores, demonstrating the positive impact of empathetic brand actions.
- Netflix: When Netflix raised prices, sentiment analysis revealed that customer concerns centered more on content quality than the price increase itself, providing valuable feedback for strategic planning.
Actionable Tips:
- Establish Baselines: Track sentiment during normal periods to establish a baseline and recognize significant shifts.
- Human Oversight: Combine automated analysis with human review for controversial or complex topics to ensure accuracy.
- Set Up Alerts: Configure alerts for sudden sentiment changes that may require immediate response and intervention.
- Segmentation: Segment sentiment analysis by topic, product line, or demographic for more actionable insights.
- Correlate with Customer Service: Track sentiment alongside customer service response times to identify correlations and areas for improvement.
Popularized By: Social listening platforms like Brandwatch, Meltwater, and Talkwalker; NLP technology companies like IBM Watson and Google Cloud Natural Language API; and PR measurement firms specializing in reputation management frameworks.
By incorporating sentiment analysis into your social media strategy, you can gain a deeper understanding of your audience's emotional responses, identify potential issues early on, and ultimately build stronger, more meaningful connections with your customers. This metric is essential for anyone seeking to truly understand the impact of their social media presence and leverage it for business success.
Social Media Engagement Metrics Comparison
| Metric | Implementation Complexity 🔄 | Resource Requirements 🔄 | Expected Outcomes 📊 | Ideal Use Cases 💡 | Key Advantages ⭐ |
|---|---|---|---|---|---|
| Engagement Rate | Medium – requires tracking likes, comments, shares | Moderate – platform data + calculation tools | Measures audience interaction quality | Content performance comparison, audience interest | Reflects true audience engagement beyond followers |
| Reach and Impressions | Low – basic tracking of views and unique users | Low – native analytics tools | Visibility and exposure insights | Assessing content reach, viral potential | Clear measure of content breadth and frequency |
| Click-Through Rate | Medium – tracking clicks vs. impressions | Moderate – link tracking and analytics setup | Traffic-driving effectiveness | Paid campaigns, website traffic conversion | Direct measurement of call-to-action success |
| Conversion Rate | High – requires tracking conversions post-click | High – integration of social and web analytics | Business outcome attribution | ROI measurement, revenue-focused marketing | Directly ties social media to sales and leads |
| Share of Voice (SOV) | High – competitive data collection and analysis | High – social listening tools + competitor data | Brand visibility vs competitors | Competitive benchmarking, market positioning | Provides crucial competitor context and market insights |
| Amplification Rate | Medium – tracking shares relative to posts | Moderate – platform-specific share data | Viral potential and audience advocacy | Identifying shareable content, organic growth | Shows audience willingness to promote content |
| Video Engagement | Medium-High – tracking views, watch time, retention | Moderate to High – video analytics platforms | Engagement depth and video content performance | Video content optimization and audience retention | Detailed insight into video consumption quality |
| Sentiment Analysis | High – requires NLP & machine learning tools | High – sophisticated sentiment platforms | Audience emotional tone and perception | Crisis management, brand reputation monitoring | Adds emotional context beyond raw engagement |
Putting Social Media Engagement Metrics to Work
Mastering social media engagement metrics is crucial for any successful social media strategy. From engagement rate and reach to sentiment analysis and video metrics, understanding these key performance indicators (KPIs) provides a data-driven roadmap for optimizing your content and achieving your business goals. We've explored eight essential social media engagement metrics in this article, highlighting their significance and how they contribute to a more effective social media presence. The most important takeaway? These metrics aren't just numbers; they're valuable insights into your audience's behavior, preferences, and how they interact with your brand.
Want to see better results from your social media strategy? You need to understand your engagement metrics. By tracking and analyzing these metrics, you can gain valuable insights into what's working and what's not. This data-driven approach can help you optimize your content, target your audience more effectively, and ultimately boost your results. Check out this resource on how to increase social media engagement.
By consistently monitoring and analyzing these social media engagement metrics, you can refine your content strategy, target your audience more effectively, and demonstrate a clear return on investment (ROI). Don't feel overwhelmed – start by focusing on a few key metrics aligned with your specific objectives and gradually incorporate others as your strategy evolves.
Streamline your social media management and free up valuable time for analysis and optimization with EvergreenFeed. EvergreenFeed automates your content scheduling, allowing you to focus on leveraging your social media engagement metrics for impactful results. Sign up for a free account today and elevate your social media performance.