Why Most Social Media Reports Miss the Mark
Let’s be honest for a second. How many social media reports have you seen that are just pretty documents packed with vanity metrics? They tell a nice story about likes, shares, and follower counts, but they often fail to connect those numbers to what really matters—actual business growth. The core problem is a gap between what social platforms easily count and what your leadership team needs to know. It’s not that engagement is bad, but we have to understand its true purpose.
This focus on surface-level data is a common trap. With the social media analytics market expected to grow from $10.23 billion in 2024 to $17.39 billion in 2025, the pressure to deliver data-heavy reports is intense. But this explosion of tools can create more noise than signal, making it even tougher to pull out real insights. You can find out more about this market growth to see just how big this industry is getting.
The Vanity Metric Trap
When you only highlight engagement metrics, you end up with a report that looks busy but says very little. For instance, a big spike in likes on an Instagram post feels great, but what did it accomplish? Did it drive website visits, get newsletter sign-ups, or bring in sales leads? Without that context, the "win" is pretty hollow. A report showing a 10% follower increase but a 5% drop in referral traffic from that same platform is actually waving a red flag, not celebrating a success.
The best teams move away from this obsession with vanity numbers. They start correlating social media activities with revenue and customer lifetime value. They ask harder questions, which turns their social media analytics report template from a simple scorecard into a powerful strategic tool.
Identifying Your Blind Spots
So, how can you tell if your reports are falling short? A great starting point is to step back and review your entire strategy. To figure out why your reports might not be hitting the mark, think about conducting a full social media marketing audit. This process makes you look beyond the dashboard and ask if your metrics are actually tied to your main business objectives. A strong report doesn’t just show data; it tells a story that links your social media efforts to real business results.
Setting Up Your Analytics Foundation

Before you even think about designing a social media analytics report template, you need to get your data in order. Many teams jump straight into making flashy charts, only to discover their data is messy, incomplete, or disconnected. It's not about hooking up every tool you have; it's about strategically collecting the information that answers your most important business questions.
A great place to start is with an audit of your entire social media presence. What are you tracking right now? More importantly, what are you not tracking? Identifying these gaps is the first real step. For instance, you might see plenty of on-platform engagement but have no idea how to link website conversions back to a specific social campaign. It helps to first understand the broader field of analytics, as this knowledge underpins any effective report and helps you tell a coherent story that connects your team’s work to business results.
Organizing Your Data Streams
A classic mistake is treating each social platform as its own separate island. To build a powerful report, you need to bring these different data streams together. Begin by creating consistent naming conventions and tracking parameters for all your campaigns. This simple step keeps your data accurate and makes comparing performance across channels much easier.
Consider these actions to get started:
- Audit your tracking pixels and tags: Double-check that they are installed and firing correctly on your website and key landing pages.
- Define your attribution model: How will you give credit for conversions? Will it be the first touch, the last touch, or a mix of interactions? Make a decision and stick with it.
- Centralize key data points: Use a simple spreadsheet or a dedicated tool to pull together metrics like reach, engagement rate, and click-through rates from all your channels into one place.
This foundational work is more important than ever. The social media analytics market is projected to grow from around $13 billion in 2025 to over $43.25 billion by 2030. Getting your data house in order now will set you up for success as the field expands. You can read the full research about this market growth to see what’s driving this incredible expansion.
Selecting Metrics That Actually Matter for Your Business
The best social media analytics report template isn't a generic document you download; it's a strategic tool you build around your specific business goals. It's easy to get caught up in vanity metrics, but obsessing over follower counts when your real goal is generating leads is a surefire way to misjudge your performance. The trick is to pick metrics that directly show your progress toward your objectives and tell a clear story about your social media impact.
Think about it this way: a B2B software company and an e-commerce fashion brand measure success very differently. The software company is probably laser-focused on lead quality from platforms like LinkedIn and how many webinar sign-ups they get from social ads. Meanwhile, the fashion brand is more interested in click-through rates on product links and sales driven by Instagram Stories. Your metrics have to align with your strategy, which is why having a clear plan is so crucial before you even start looking at data. You can learn more about building this foundation in our guide on how to create a social media plan.
Tying Metrics to Business Goals
To get started, you need to draw a straight line from your social media posts to real business outcomes. This means looking past simple likes and shares to see how your efforts affect revenue, customer acquisition cost, or brand loyalty.
To help you connect your goals to the right numbers, we've put together a table that breaks down which metrics to track for different business objectives.
Table: Essential Social Media Metrics by Business Goal
Comparison of key metrics organized by primary business objectives with recommended tracking frequency
| Business Goal | Primary Metrics | Secondary Metrics | Tracking Frequency |
|---|---|---|---|
| Brand Awareness | Reach, Impressions | Share of Voice, Follower Growth Rate | Weekly/Monthly |
| Driving Conversions | Conversion Rate, Click-Through Rate (CTR) | Cost Per Conversion (CPC), Return on Ad Spend (ROAS) | Weekly/Bi-weekly |
| Engagement | Engagement Rate (Likes, Comments, Shares) | Amplification Rate, Virality Rate | Daily/Weekly |
| Customer Loyalty | Repeat Customer Rate, Sentiment Analysis | Customer Lifetime Value (CLV), Testimonial/Review Count | Monthly/Quarterly |
This table shows how different goals require focusing on different sets of data. While a brand awareness campaign lives and dies by reach and impressions, a conversion-focused campaign needs to be judged on its ability to drive sales, making conversion rate and CTR the stars of the show.
Let’s break this down further:
-
For Brand Awareness: Your main goal is to get in front of as many relevant eyes as possible. Reach and impressions tell you how many people are seeing your content, while share of voice shows how you stack up against your competitors.
-
For Driving Conversions: Here, it’s all about action. You need to track click-through rate (CTR), conversion rate, and cost per acquisition (CPA). These numbers tell you exactly how good your social content is at turning followers into paying customers.
-
For Customer Loyalty: This is about building a community. You should monitor your repeat customer rate from social media and use sentiment analysis to gauge how people feel about your brand. This helps you see if you're creating a base of fans who will stick around.
To get a more granular view, it's helpful to understand the math behind key metrics. For instance, knowing the Instagram engagement rate formula can help you confirm if your content is truly hitting the mark with your target audience. When every number in your report has a purpose and a direct link to your bottom line, it stops being just a report and becomes a powerful strategic tool.
Creating Reports That Stakeholders Actually Use

Even the most brilliant insights get lost if they're buried in a report nobody reads. The true value of a social media analytics report template isn’t just the data inside it, but how it presents that data as a clear, convincing story. Your job is to guide stakeholders through your findings, not just send them a wall of numbers.
Think of it like being a visual designer. Simple choices in color, chart types, and layout can turn a dense spreadsheet into an easy-to-understand narrative. For instance, instead of using a cluttered pie chart with ten different slices, a clean bar graph makes it instantly obvious which channels are performing best. This visual hierarchy guides the reader's eye to what's most important—a lifesaver for busy executives who might only have a minute to skim your report.
From Data Dump to Strategic Narrative
A classic mistake is feeling the need to show everything. An effective report finds a balance between providing thorough analysis and telling a focused story. The key is knowing your audience and what they need to see.
- For Executives: Lead with a strong executive summary. This should be a 30-second overview that hits the main points: what succeeded, what failed, and what you plan to do about it. Use bold text to highlight key performance indicators (KPIs) and major accomplishments.
- For Your Team: This is where you can get more detailed. Include breakdowns of top-performing posts, complete with screenshots and a short analysis of why a particular piece of content resonated. This is how your team learns and repeats what works.
Ultimately, your report should do more than just inform; it should spark conversations and inspire action. When you customize your presentation for different stakeholders, you make sure your hard-earned insights don't just get archived. They become the building blocks for smarter decisions that move your strategy forward and show real results.
Smart Automation That Enhances Human Insights

Let’s be clear: strategic automation isn’t about replacing the analyst. It’s about getting them out of the weeds of manual data collection so they can focus on what really matters—the story behind the numbers. A well-built social media analytics report template uses tools to automatically pull data, but the real value comes when this efficiency gives you more time for the human context that separates a great report from a generic dashboard.
Think of it as giving yourself a smart assistant. The goal is to cut down the hours spent on tedious tasks without losing the strategic interpretation that makes your report valuable. This is where choosing the right tools is key, something you can learn more about in our complete social media automation guide.
Balancing Efficiency with Strategic Thinking
The trick is to automate the what so you have the headspace to analyze the why. For example, instead of manually compiling engagement metrics every week, you can set up automated data pulls that feed directly into your template. This frees you up to investigate why a specific post took off, not just report that it did.
Here’s how effective teams strike this balance:
- Dynamic Visualizations: They use reporting tools to create charts and graphs that update in real-time. This makes the report a living document, not just a static snapshot from last Tuesday.
- Intelligent Alerts: They build alert systems to flag important performance changes, like a sudden drop in reach or a spike in negative comments. This allows them to be proactive instead of waiting for the next scheduled report.
This shift toward automation is a huge factor in the industry’s growth. In fact, the social media analytics market is projected to grow by an additional $21.2 billion between 2025 and 2029. You can discover more about this market forecast to see how automation is changing the reporting game. Ultimately, you let automation handle the grunt work, which allows you to deliver the strategic insights that numbers alone can never provide.
Converting Insights Into Strategic Actions
A good report shows you what happened; a great report tells you what to do next. The real value of your social media analytics report template is its power to trigger specific, measurable actions. It's all about turning those numbers and charts from interesting observations into a clear plan for what to do better. For instance, if you notice your video content gets 3x more engagement than static images, the next step isn't just to "make more videos."
Instead, it's about reallocating your content creation budget to produce two additional high-quality videos each month. The goal? To increase your overall engagement by 15% in the next quarter. This moves you from simply observing data to actively using it for growth. This structured process ensures the insights you work hard to uncover don't just sit in a folder.
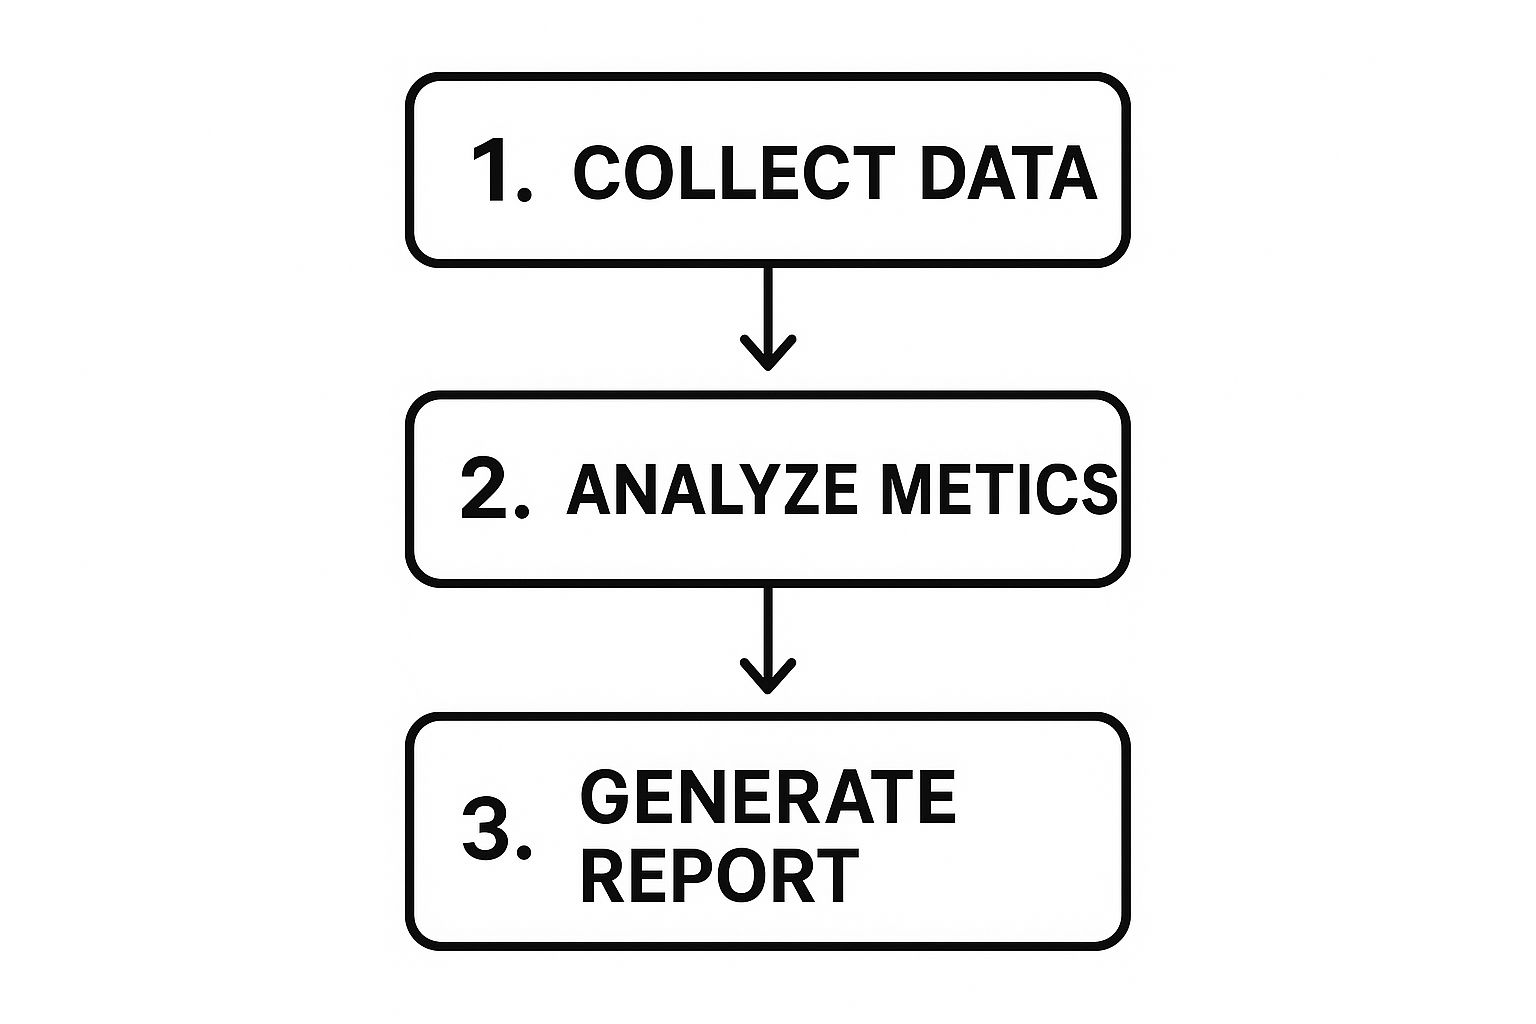
As the infographic shows, generating the report is the final piece of the puzzle, built on a foundation of solid data collection and thoughtful analysis.
From Findings to Action Plans
To make this process seamless, dedicate a section of your report specifically to recommendations. This is where you translate each key finding into a concrete task. For example, discovering that posts published between 9-11 AM get the most clicks should directly lead to an action plan to adjust your publishing schedule.
Here’s a simple framework for framing these recommendations:
- Identify the Insight: "Our top-performing content consistently features customer testimonials."
- Propose a Clear Action: "We should launch a 'Customer Spotlight' series, sharing one new story every two weeks."
- Set a Success Metric: "The goal is to boost website referral traffic from these posts by 20%."
To help you put this into practice, here’s a framework that bridges the gap between seeing a trend and making a change. It outlines how to turn different types of insights into clear, time-bound strategies.
| Action Planning Framework for Social Media Analytics |
| :— | :— | :— | :— |
| Insight Type | Recommended Action | Implementation Timeline | Success Metrics |
| Low Engagement on Static Images | Reallocate 20% of the content budget from static images to video production. | Within the next 30 days | Increase average engagement rate by 15% over the next quarter. |
| High Click-Through Rate (CTR) from 9-11 AM | Adjust the primary publishing schedule for all platforms to target the 9-11 AM window. | Immediately (starting next week) | Achieve a 10% increase in overall CTR within one month. |
| Customer Testimonials Drive High Reach | Launch a bi-weekly "Customer Spotlight" content series featuring user stories. | Plan in 2 weeks, launch in 4 weeks | Boost referral traffic from social media by 20% in 60 days. |
| Negative Sentiment on Product X | Create a tutorial video and FAQ post addressing common customer pain points. | Within the next 2 weeks | Decrease negative sentiment mentions by 25% in the next reporting period. |
This framework shows how every piece of data can have a purpose. By tying actions to timelines and success metrics, you create accountability and ensure your social media strategy is constantly improving.
This approach transforms your report from a simple data summary into a powerful tool for strategic planning. Establishing this feedback loop is crucial for genuine growth and is a key part of properly measuring social media success. When you build clear next steps directly into your reporting, you guarantee that your hard-won insights lead to real-world improvements, not just forgotten presentations.
Your Complete Implementation Roadmap
Everything we've discussed comes together here, in a practical plan for rolling out and continuously improving your new reporting system. A successful launch isn't about flipping a switch overnight. It's a gradual process of building confidence, training your team, and showing the value of your work. A phased rollout prevents overwhelming stakeholders and gives you room to work out any issues in your social media analytics report template.
I always suggest starting small. Introduce the new report format to a trusted internal group first. This could be your immediate marketing team or even just a single, supportive manager. Use their feedback to make initial tweaks before a wider launch. This test run helps you anticipate questions and sharpen your story, making sure you're ready when presenting to leadership.
Timeline and Training Considerations
For a small team, a full rollout can happen in as little as one to two months. This timeline covers finalizing the template, running one or two pilot report cycles, and getting the team trained up. Larger organizations with multiple brands or more complex goals should plan for a three-to-six-month implementation. This allows for more extensive feedback and customization across different departments.
Training is non-negotiable. Don't just email the new template and hope for the best; host a workshop. Walk everyone through the key components:
- Where to find the data for each metric.
- The business goal behind each section of the report.
- How to interpret the most important charts and takeaways.
This image below shows the cyclical nature of social media analytics—from collecting data to taking strategic action. This is the very process your new report will formalize.
The diagram makes it clear that your report isn't the finish line. It's a critical step that fuels the next round of strategic decisions and optimizations for your social media efforts.
Scaling and Proving ROI
Once your new reporting system is up and running, set up a quarterly review to make sure it stays relevant. As your social media presence grows or business goals change, your template will need to evolve with them. To prove its value to skeptical leaders, you need to connect the report’s insights directly to business outcomes. For example, you can show how an insight from the report led to a strategy change that increased lead conversions by 15%. This turns the report from a simple-line item expense into a clear investment in business growth.
Ready to stop wasting time on manual posting and focus on the strategic insights that matter? EvergreenFeed automates your content schedule, giving you back the hours you need to build reports that drive real results. Start your free trial today and see the difference.