
Let's get real for a moment. Most weekly social media reports are, frankly, a waste of time. They're often just a jumble of numbers slapped onto a slide or into a spreadsheet—follower counts here, impressions there—that get a polite nod before being filed away, never to be seen again.
If that sounds familiar, you're not alone. The biggest reason these reports fail is that they’re all information and no insight.
Are You Just Reporting on "Vanity Metrics"?
The classic mistake is getting hung up on vanity metrics. Sure, seeing your follower count go up feels good, but what does it actually mean for the business? Did that sudden jump in followers lead to more people visiting your website? Did it generate any real sales leads? Most reports don't even try to answer these questions.
This isn't just a harmless mistake; chasing empty numbers can actively derail your strategy. I've seen teams pour their ad budget into campaigns optimized for "likes," only to realize they were attracting an audience with zero interest in their product. A properly designed weekly social media report template is your best defense against this, forcing you to connect the dots between your social activity and real business outcomes.
A report shouldn’t just be a look back at what happened last week. It’s your roadmap for what to do next week. It’s a strategic tool, not just a homework assignment.
Building a Report That Actually Guides Your Strategy
The goal is to create a report that gives you context and clear next steps. Instead of just noting that your reach went up by 10%, a good report digs into why it happened. Was it that one video? A particular topic? A new hashtag? Once you know the why, you can figure out how to make it happen again.
This mindset shift is crucial, especially when you think about social media on a global scale. There are over 5.24 billion active users out there, and what "good" looks like can vary wildly.
For example, growing your audience in a market like Eastern Asia, where social media penetration is nearly 97%, is a completely different challenge than in Middle Africa, where it’s closer to 30%. Your report needs to reflect these realities to provide insights that are truly useful. If you're managing international accounts, it's worth digging into global social media trends to set realistic benchmarks.
Defining Your Reporting Goals and KPIs
A great weekly social media report doesn't start with data—it starts with a question: What are we actually trying to accomplish here? Without a clear answer, you're just assembling a pile of numbers. Your report needs to be a strategic tool, not a data dump.
Before you can even think about measuring success, you have to define what success looks like for your brand. Are you trying to hand-deliver qualified leads to your sales team? Is the main objective to build brand awareness in a new market? Or maybe you're focused on nurturing customer loyalty and keeping your existing audience engaged.
Your answer to that question shapes everything else. Getting this right from the start ensures every metric you track has a clear purpose and ties directly back to a meaningful business objective.
Selecting Your Key Performance Indicators
Once you've got your goals locked in, it's time to pick the Key Performance Indicators (KPIs) that will actually measure your progress. KPIs are the specific, quantifiable data points that tell you whether your strategy is hitting the mark or falling flat. For a deeper dive into the theory behind this, resources on mastering Key Performance Indicators can be really helpful.
Let's look at a real-world example. If your goal is brand awareness, you'll want to track KPIs like:
- Reach: How many unique people saw your content.
- Impressions: The total number of times your posts were displayed.
- Share of Voice: How your brand's mentions stack up against your competitors.
But if your goal is lead generation, those metrics won't tell you the whole story. You’ll need a completely different set of KPIs, such as:
- Click-Through Rate (CTR): The percentage of people who saw your post and clicked a link.
- Conversion Rate: The percentage of those clickers who took the next step, like filling out a form.
- Cost Per Lead (CPL): The average amount you spent to get one new lead through social media.
The right KPI is one that forces a decision. If a metric doesn't help you decide whether to continue, stop, or change your approach, it's not a true KPI—it's just noise.
Vanity Metrics vs Actionable KPIs
It's easy to get distracted by "vanity metrics"—numbers that look good on paper but don't actually reflect business impact. Likes and follower counts are classic examples. They feel good, but do they pay the bills? Separating these from true KPIs is critical for effective reporting.
| Metric Category | Vanity Metric Example (What to Avoid) | Actionable KPI Example (What to Track) |
|---|---|---|
| Reach & Awareness | Total Followers | Post Reach (% of audience seen) |
| Engagement | Post Likes | Comments & Shares |
| Traffic | Total Page Views | Click-Through Rate (CTR) |
| Conversions | Account Mentions | Leads Generated from Social |
Focusing on actionable KPIs ensures your report provides real insights that can steer your strategy, not just fluff that inflates egos.
Remember, setting these goals and metrics isn't just a reporting exercise; it’s a fundamental part of a solid social media strategy. If you feel like you need a better foundation, our guide on how to create a social media plan is a great place to start.
This visual breaks down the core sections of a report built for genuine strategic impact.
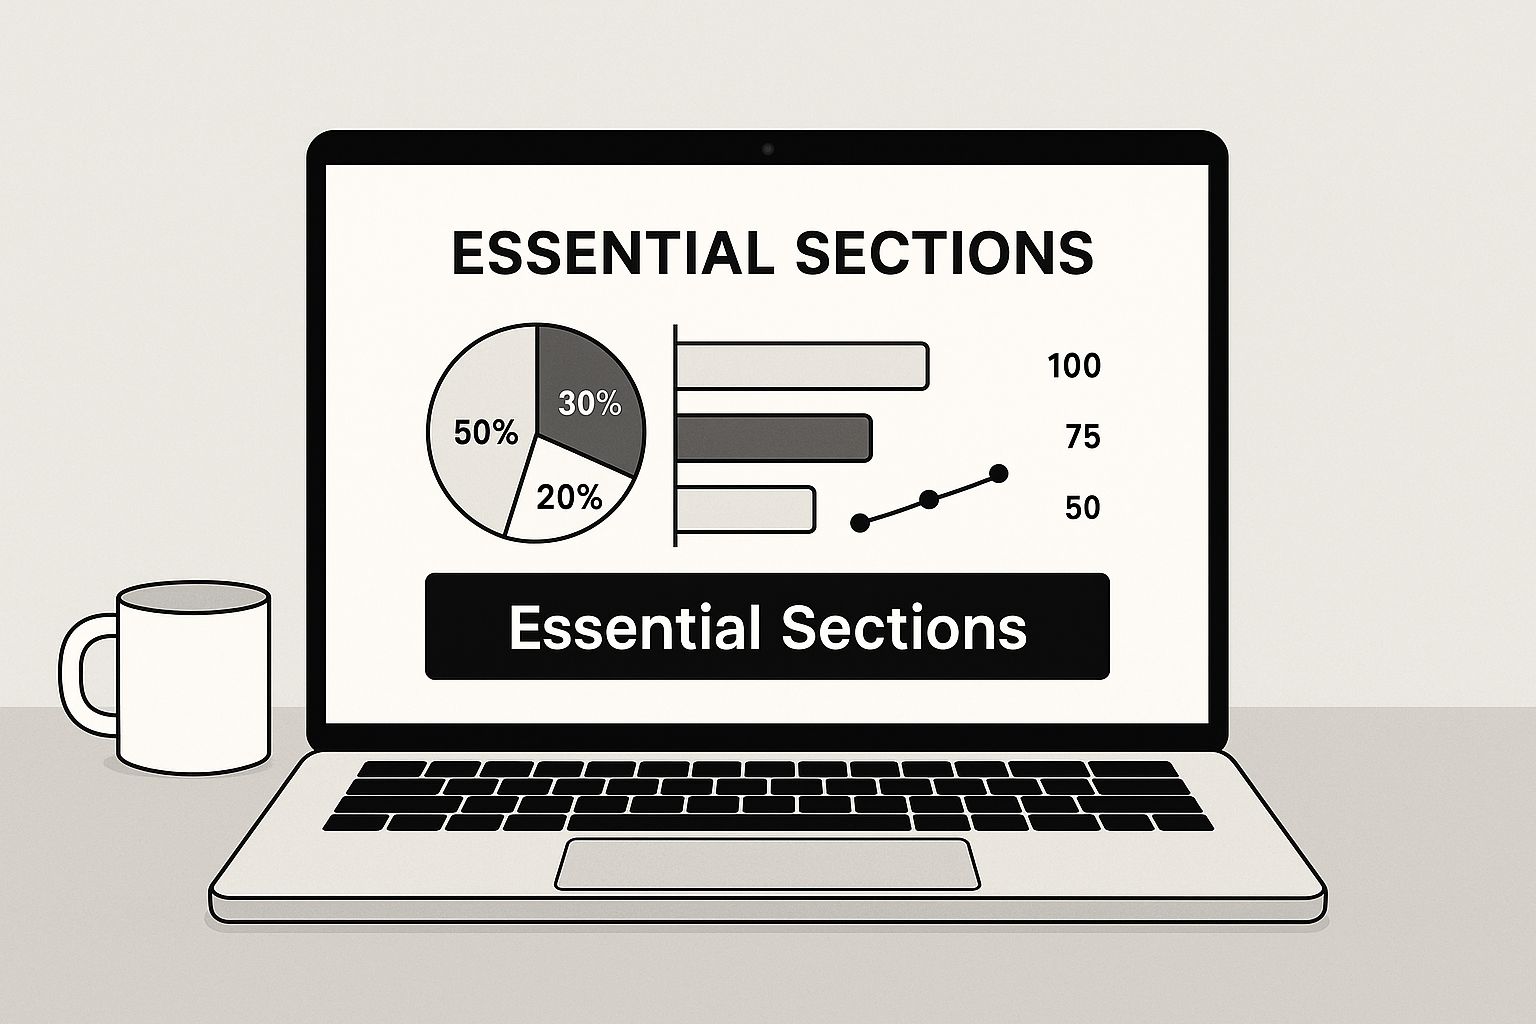
When you structure your template around these key areas, you guarantee your report tells a complete and, more importantly, an actionable story.
Breaking Down Your Report, Section by Section
A good weekly social media report tells a story. It’s not just a data dump; it’s a narrative that walks your boss or client from the big picture right down to the nitty-gritty details and, most importantly, what to do next. Let's build that story together.
Every report I've ever built starts with a "Weekly Snapshot" or an executive summary. This is for the busy executive who might only skim the first page. Keep it tight: highlight your biggest win, one key challenge you’re tackling, and a quick update on your main goal for the week.
Think of it as the trailer for your report. It hits the most important points right away, making sure everyone gets the main message even if they don't read another word.
Platform-by-Platform Performance
After the snapshot, it's time to get into the weeds for each social network. The biggest mistake I see is people using a one-size-fits-all approach to metrics. What works on LinkedIn is miles away from what matters on TikTok. Your report needs to reflect that reality.
Organize this part with clear subheadings for each platform.
- For Instagram & TikTok: I’m always looking at video views, completion rates, saves, and shares. These tell me if the content is truly hitting home—not just being passively scrolled past.
- For LinkedIn: My focus shifts to the click-through rate (CTR) on links, profile views generated from our posts, and the quality of engagement. A thoughtful comment is worth more than a dozen simple likes here.
- For Facebook & X (formerly Twitter): Here, it’s all about link clicks, comment sentiment, and the conversations happening in the threads. These are your workhorses for driving traffic and understanding public perception.
When you tailor your KPIs like this, you’re showing you understand the unique role each channel plays. It’s the difference between just reporting numbers and providing real strategic insight.
Analyzing Your Content and Audience
Next up is the "Content Performance Review." This is where you connect the dots. Don't just list your top-performing posts—dig into why they worked.
Was it the format? Maybe a Reel outperformed a static image. Was it the topic, the caption's tone, or the time you posted? Finding these patterns is the whole point. For example, you might discover, "Our client testimonial Reel got 40% more shares than our usual video content." Now that's a finding you can act on.
This flows perfectly into "Audience Insights." Sure, your follower count went up, but do you know who those new people are? Look for any shifts in your audience demographics—age, location, gender. This information is gold because it helps you tweak your content to better match the people who are actually listening.
The most valuable part of any report isn't the data. It's the final section: Key Learnings & Next Steps. This is what turns a piece of paper into a tool for growth.
This last part should be a straightforward, bulleted list of things you’re going to do.
- Learning: "Our carousel posts explaining our process have a really high save rate."
- Next Step: "Let's create two more educational carousels for next week’s content calendar."
This forward-thinking approach makes your report a living document. It ensures the insights from last week directly fuel better results for the next one.
Uncovering Deeper Insights with Advanced Analytics
https://www.youtube.com/embed/mhfpolp9rAs
A standard report tells you what happened last week. But a truly great report? It tells you what’s happening right now across your entire industry, giving you a powerful strategic advantage. To get to that level, you have to look beyond your own page and start pulling in more sophisticated data.
This is where your weekly social media report template transforms from a simple scorecard into a strategic intelligence brief. The secret is adding a rich, qualitative layer on top of all the quantitative data you've been collecting.
Listening to the Conversation
Social listening is your ticket to this deeper level of analysis. It’s a shift from just tracking your own mentions to monitoring the wider conversations happening about your brand, your products, and even your competitors. This practice is essential for gauging brand sentiment in real time.
For example, are customers suddenly frustrated with a recent product update? Or are they raving about your fantastic customer service? These are the golden nuggets of insight that absolutely belong in your weekly report.
You can also apply this to your competitors. Did a rival just launch a new campaign that's generating a ton of buzz? Analyzing their strategy and the public's reaction gives you crucial context for your own performance.
Expert Tip: Adding a "Competitor Snapshot" or "Industry Trends" section to your report immediately elevates its strategic value. It shows you’re not just managing a channel; you're actively monitoring the entire market.
Harnessing AI for a Deeper Read
Let’s be honest—manually sifting through hundreds of comments to gauge sentiment is a non-starter. This is where AI-powered tools become your best friend, helping you analyze comment sentiment at scale and spot the themes bubbling up in audience conversations.
The impact is significant. Around 90 percent of businesses using generative AI tools report meaningful time savings, and 73 percent see real increases in engagement. What’s more, teams that use social listening tools have been found to have double the confidence in their social media ROI.
By including AI-driven sentiment analysis, you turn raw data into actionable insights, making your report exponentially more powerful. For more ideas on structuring this kind of data, check out our comprehensive guide to building a social media analytics report template.
Weaving a Story from Your Data

Let's be honest: raw data is just a collection of numbers. It’s the analysis—the story you tell with it—that gives it meaning. This is where your expertise truly shines in a weekly social media report. You need to move past simply listing metrics and dig into the why behind them.
Did engagement take a nosedive? Maybe that new content format you tried didn't quite land with your audience. Or perhaps you shifted your posting schedule and missed their peak activity window. It could even be a sneaky algorithm update impacting your reach. The narrative you build turns a dry report into a powerful tool that stakeholders can actually understand and use.
Writing Your Weekly Commentary
Every good report tells a story. Think of it as having a clear beginning, middle, and end. I always like to start with the wins, even the small ones. It sets a positive tone and shows progress.
For example, instead of just saying, "Impressions went up 15%," try framing it with the cause: "Our new behind-the-scenes video series drove a 15% week-over-week increase in impressions, proving our audience is hungry for more authentic content." See the difference?
Next, tackle the challenges head-on, but with curiosity, not excuses. Acknowledging a dip in performance isn't a sign of failure; it’s a learning opportunity. Frame it as an investigation. "We saw our link clicks drop by 10% this week. We think our call-to-action might have been too subtle, so we're going to test a more direct CTA in next week's posts."
Your goal is to provide concise, insightful commentary for each key metric. This narrative should celebrate wins, transparently address challenges, and deliver clear, data-backed recommendations for the week ahead.
This approach builds a ton of trust. It shows you're actively steering the ship, not just watching the waves. It also respects the sheer volume of content out there—with global users spending an average of 2 hours and 24 minutes on social platforms daily, every post is in a battle for attention.
Turning Insights into Actionable Recommendations
This is the most critical part of your report. It’s where you connect the dots from what you've learned to what you’re going to do next. Your recommendations need to be direct, supported by your data, and easy for your team to implement.
Here’s how that might look in practice:
-
What we saw: The carousel post educating followers on our process had the highest save rate of the week.
-
What we'll do: Create two more educational carousel posts for next week's schedule.
-
What we saw: Our text-only posts on LinkedIn have been getting consistently low engagement.
-
What we'll do: Experiment with two video posts on LinkedIn next week to see if we can spark more interaction.
This forward-looking mindset is what transforms your weekly social media report template from a static document into a living tool for growth. The insights from one week directly fuel the strategy for the next, creating a powerful feedback loop. Using a structured social media content calendar is a great way to map out and execute these data-driven ideas.
Got Questions? We’ve Got Answers.
Even with the perfect weekly social media report template, you're bound to run into some tricky situations. I've been there. Here are some of the most common questions I hear from other social media managers and how I've learned to handle them.
How Often Should I Actually Be Reporting?
This is a classic question, and the answer is: it depends on who's reading it.
For the folks in the trenches with you—the social team, the content creators, the digital ad buyers—a weekly report is gold. It’s what helps you stay agile, spot what's working (or what's bombing), and make quick pivots to your strategy.
But when you're talking to leadership or clients, a weekly data dump is just noise. They need a bigger picture. For them, stick to monthly or even quarterly reports. These should be less about day-to-day fluctuations and more about connecting social media performance to high-level business goals, like brand growth or lead generation.
What’s the One Metric That Matters Most?
I wish it were that simple! The truth is, there's no single magic metric. The most important number is the one that directly measures the goal of your specific campaign.
Here’s how I think about it:
- If your goal is brand awareness, you’ll want to zero in on Reach and Impressions.
- If you’re running a lead generation campaign, then Click-Through Rate (CTR) and Conversion Rate are your best friends.
Don’t fall into the trap of tracking vanity metrics. The real skill is in picking the few key numbers that tell you if you're actually achieving what you set out to do.
What Happens When Data Goes Missing?
It’s the worst, right? One day your report is humming along, and the next, a platform changes its API and a key metric is gone. It happens to everyone.
The key is transparency. Don't just leave a blank space. Add a note directly in the report explaining exactly what happened and why that data is suddenly unavailable.
Your next move is to find a proxy metric. For example, if a platform suddenly stops providing detailed engagement data, you could start tracking referral traffic from that channel in Google Analytics. It’s not a perfect substitute, but it shows you're still working to measure the platform's impact and provides a solid alternative story.
Ready to stop wasting time on manual scheduling and start building a powerful library of evergreen content? EvergreenFeed automates your social media workflow, ensuring your best posts are always in rotation. Sign up for free and start automating your content today.