
Understanding Social Media Marketing Metrics That Matter
Imagine your social media strategy is a ship setting sail on a vast digital ocean. Without the right navigation tools, you're essentially sailing blind, hoping to somehow drift toward your business goals. Many businesses find themselves lost in a sea of vanity metrics—numbers like follower counts and likes that look great on the surface but don't tell you anything about your actual business performance. They're like the ship's horn: loud and attention-grabbing, but they won't help you chart a course.
To truly navigate, you need to focus on the social media marketing metrics that act as your compass and map. This is more important than ever. With roughly 5.42 billion social media users across the globe, the opportunity is huge, but so is the competition. Algorithms now favor genuine interaction, pushing brands to move beyond just broadcasting content and start having meaningful, data-informed conversations. You can explore the latest data in this report on social media trends and statistics.
From Vanity to Value: A Strategic Shift
The difference between a thriving brand and one just burning through its marketing budget is a focus on metrics tied directly to business objectives. It's about changing the question from "How many people saw our post?" to "What valuable action did people take after seeing our post?" Think of it this way: tracking followers is like counting people who walk past your storefront. Tracking conversions is like knowing how many of those people came inside, made a purchase, and decided to come back. One feels good; the other actually grows your business.
The Power of Actionable Data
This guide is not about drowning in data; it’s about finding the right data. We will look at how real companies turned their social media from a budget item into a revenue source by focusing on what truly matters. For example, video content is a major force for engagement, but it's vital to look past simple view counts. To really see what's resonating, you need to understand essential video engagement metrics like watch time and audience retention, which show how deeply your content connects.
By concentrating on these actionable insights, you can answer critical business questions:
- Which content formats generate the most leads?
- Which social platforms bring the best traffic to your website?
- What is the real cost of acquiring a new customer through your social media efforts?
Answering these questions transforms your social media presence from a guessing game into a predictable, measurable engine for growth.
The Essential Metrics That Drive Business Growth
Beyond the initial excitement of likes and shares lies the real engine of social media success: social media marketing metrics that are directly tied to business outcomes. While a competitor might celebrate a viral post, a savvy marketer is tracking the numbers that truly matter—like how much it costs to acquire a customer and the long-term value that customer brings. This is about creating a measurement hierarchy, moving from surface-level indicators like awareness to the bottom-funnel results that actually generate revenue.
Not all metrics are created equal, and their importance shifts based on your specific business model. A SaaS company, for instance, might be obsessed with trial sign-ups coming from its social media channels. In contrast, an e-commerce brand will likely focus on recovering abandoned carts through social retargeting ads. The goal is to build a custom framework that aligns with your unique objectives, whether that's generating qualified leads, driving direct sales, or building lasting brand equity.
The infographic below illustrates this hierarchy, showing how different metrics connect to broader business goals.
This visual shows a clear path from basic awareness metrics to the vital conversion and revenue data that defines success. Ultimately, you want to concentrate on predictive metrics—those that help forecast future performance rather than just reporting on what has already happened.
Building Your Metrics Framework
The sheer scale of social media today makes this precision vital. In 2025, an estimated 5 billion people—nearly 64% of the world’s population—are expected to be active social media users, spending an average of 2 hours and 21 minutes on these platforms daily. This massive engagement presents a huge opportunity but also fierce competition for attention. To learn more about these figures, you can explore the latest global social media usage trends on Smart Insights.
Given these numbers, tracking performance with metrics like click-through rates and conversion rates is essential for refining your campaigns and maximizing your return on investment.
To build your framework, it's helpful to categorize your metrics into three core areas:
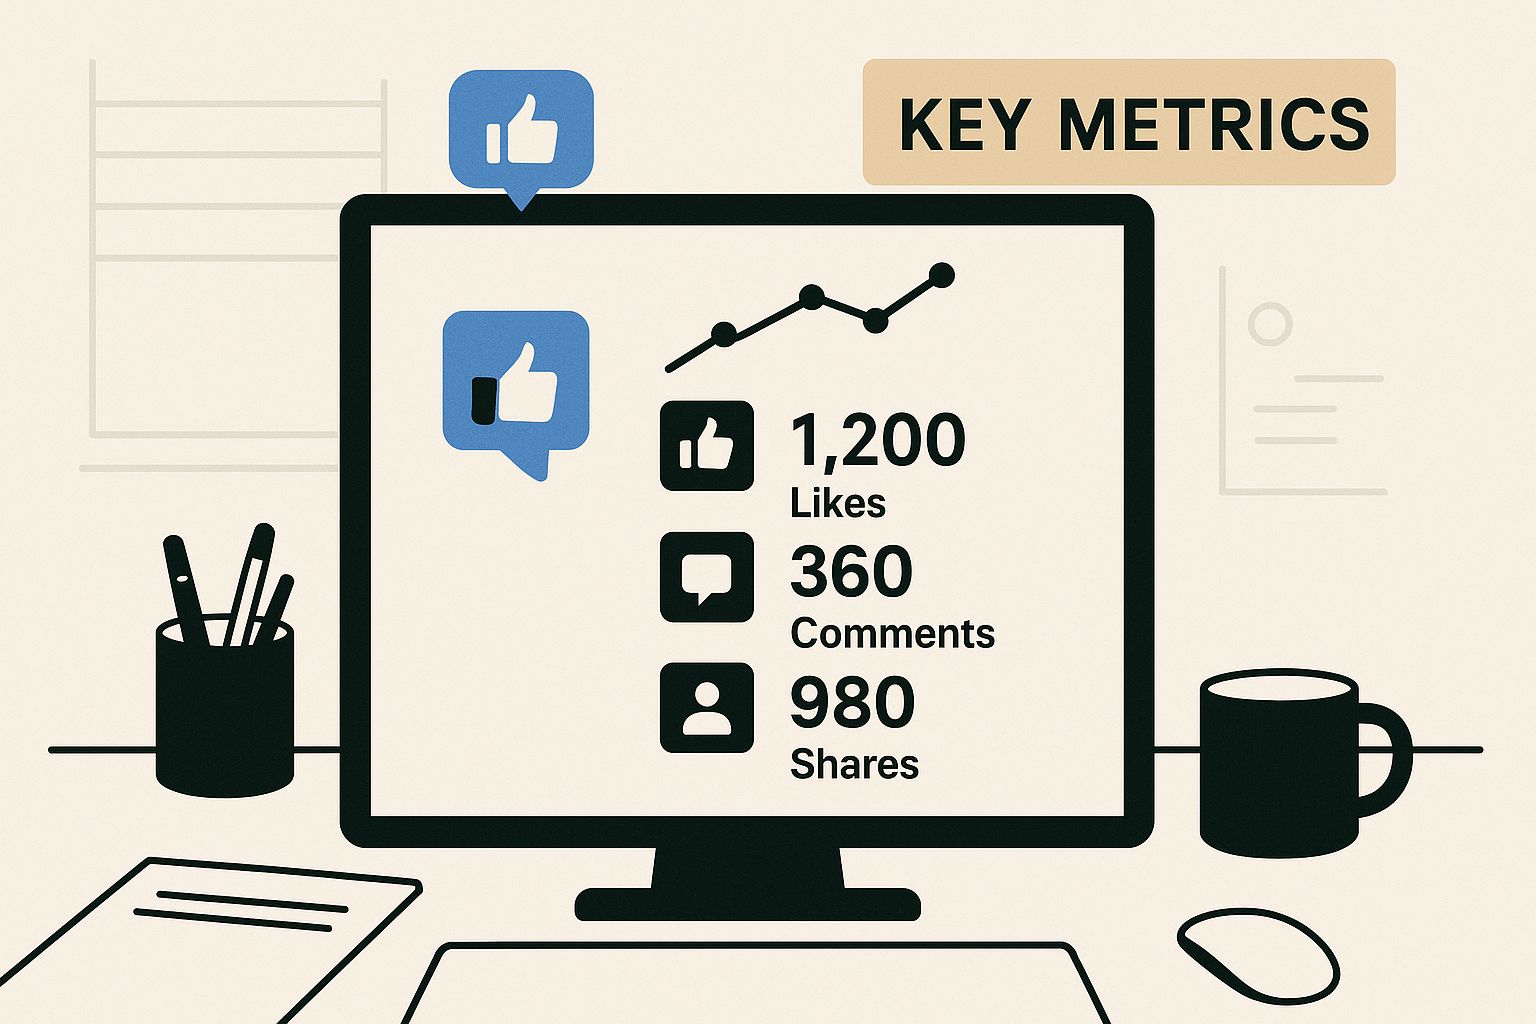
- Awareness Metrics: These top-of-funnel numbers, like impressions and reach, tell you how many unique users are seeing your content. They indicate the potential size of your audience.
- Engagement Metrics: This category includes likes, comments, shares, and saves. High engagement suggests your content is resonating, which is a strong signal of audience interest and content quality.
- Conversion Metrics: These are the bottom-line numbers: lead generation, sales, and sign-ups. They measure the actions that directly contribute to your business growth and are the ultimate test of your social media strategy’s effectiveness.
Platform-Specific Metrics: Each Network's Hidden Goldmine
While general social media marketing metrics like reach and engagement provide a great overview, treating every platform the same is like using a single key for a dozen different locks. Each social network has its own unique audience behavior and algorithmic priorities. This creates a goldmine of specific metrics that can reveal optimization opportunities others might miss. Unlocking this platform-specific data is essential for building a truly effective strategy.
Going Beyond Surface-Level Numbers
Thinking beyond standard metrics allows you to align your content with how users actually behave on each platform. For instance, a high number of Saves on an Instagram post is a powerful indicator that your content is seen as valuable and evergreen—often more so than a simple like. On LinkedIn, a high comment-to-share ratio signals that your content is sparking meaningful professional dialogue, a key goal on that network.
These more detailed metrics offer a deeper understanding of your content's performance:
- TikTok Completion Rate: This shows how many viewers watched your entire video. A high completion rate is a strong signal to TikTok's algorithm that your content is engaging, leading to greater visibility.
- Facebook Negative Feedback Score: A metric that tracks how often users hide your posts or report them as spam. Keeping this low is crucial for maintaining healthy organic reach on Facebook.
- X (formerly Twitter) Profile Visits: Found in tweet analytics, this metric can be a better indicator of brand interest than link clicks alone. It shows that users on X are actively seeking more information about you.
Adapting to a Changing Ad Environment
Understanding platform differences is also vital for paid campaigns. Recent data shows significant shifts in advertising effectiveness and user trust across platforms. For example, YouTube now leads global ad reach, exposing ads to 2.53 billion users monthly. However, user trust varies greatly; only 18% of US users trust Facebook with their data, while LinkedIn is seen as more privacy-protective. These factors directly impact ad performance, as trust influences how people engage with your ads. You can explore the latest social media statistics on ClearVoice.com to see more on these trends.
By digging into these platform-specific details, you can refine your content, improve ad performance, and ultimately build a more robust and responsive strategy. This granular approach is a core part of any successful social media plan; to learn more, check out our guide on how to create a social media plan.
Building Your Measurement System That Actually Works
Collecting social media data without a clear system is a lot like trying to build a house with a pile of lumber but no blueprint. You have all the raw materials, but no structure to turn them into something useful. The most effective marketers don’t just gather social media marketing metrics; they build a measurement system that uncovers insights and guides their next steps. This system is your blueprint for turning raw numbers into smart business decisions.
A solid measurement system pulls together different data sources to create a single, clear picture of your performance. It helps you move past isolated platform dashboards and messy spreadsheets to create a tracking method that can grow with your business. To truly measure social media success, your approach needs to be part of broader marketing campaign tracking strategies. This bigger view is what connects your social media activities to your main business goals.
Combining Native and Third-Party Tools
Think of your measurement system as having two essential parts. The first part is the native analytics that each social platform provides. These are your on-the-ground tools, perfect for understanding platform-specific behaviors like how many people save your Instagram posts or the demographics of your LinkedIn followers. They give you immediate, detailed feedback on what content works best within that specific environment.
However, to see the complete customer journey, you need to add a second layer: third-party tools. Tools like Google Analytics or a CRM connect the dots between your social media activity and real business outcomes. By using UTM parameters—special codes you add to your links—you can track exactly how many people clicked a specific tweet and then went on to buy a product or sign up for your newsletter. This is where you start answering the most important questions about performance. For a closer look at this process, check out our guide on how to measure social media ROI for practical steps.
From Manual Reporting to Automated Insights
An effective system should also cut down on manual work. Instead of spending hours exporting data into spreadsheets, you can create custom dashboards that automatically pull in key metrics from multiple sources. A well-designed dashboard tells a story at a glance, showing key performance indicators (KPIs) to stakeholders without burying them in extra data.
This frees up your time to focus on what really matters: analyzing trends, spotting opportunities, and adjusting your strategy based on what the data tells you. The goal is to create a system that helps you take action, not just generate reports.
Reading Your Data Like a Detective

Raw numbers without context are just expensive noise. The real skill in analyzing social media marketing metrics is learning to be a data detective—turning a confusing list of figures into clear, strategic intelligence that guides your every move. Just glancing at metrics isn't enough; you need to investigate what they’re truly revealing about your audience and your campaigns.
Imagine seeing a sudden spike in engagement. A beginner might just celebrate the win, but a data detective starts asking questions. Was our content shared by a major influencer? Did a relevant news event happen in our industry? Or, on the flip side, is this engagement low-quality, maybe from bots? A post with tons of likes but zero website clicks is a major clue that something is off. The content was entertaining, but it failed to drive the action that matters to your business. The goal is to separate correlation from causation.
Distinguishing Trends From Noise
Just like a detective searches for patterns at a crime scene, you must learn to tell the difference between a random, one-off fluctuation and a meaningful trend. A small dip in reach one week could just be a normal hiccup in the algorithm. But a steady decline over a month points to a deeper issue, like a problem with your content strategy.
Advanced analysis techniques can give you the critical clues you need:
- Cohort Analysis: This method groups users by a shared trait (like the week they first followed you) and tracks their behavior over time. It can reveal if your newest followers are less engaged than older ones, which might indicate a shift in your audience quality.
- Attribution Modeling: Instead of giving all the credit for a sale to the very last click, multi-touch attribution helps you understand the entire customer journey. You might discover that while your Facebook ads are closing sales, your organic LinkedIn posts played a key role in building initial awareness.
- Competitive Benchmarking: This shows how your performance compares to your competitors. Are your engagement rates actually low for your industry, or are you secretly leading the pack?
This level of investigation turns data from a simple report card into a detailed case file full of actionable leads. To help you become a better data detective, the table below decodes what some common metric patterns really mean.
Common Metric Scenarios and Their Real Meanings
Decode what different metric patterns actually tell you about your campaign performance and next steps.
| Metric Pattern | What It Usually Means | Potential Causes | Recommended Actions |
|---|---|---|---|
| High Reach, Low Engagement Rate | Your content is being seen by many people, but it isn't compelling enough to make them act. | The content is generic or uninteresting. The call-to-action is weak or missing. Your audience targeting is too broad. | A/B test different creative elements (images, headlines). Refine your CTA to be more direct. Use more specific audience targeting. |
| High Likes, Low Clicks/Conversions | The content is enjoyable or "likeable" on the surface, but it's not driving the desired business outcome. | The content is purely entertaining without a clear link to your product. The link is broken or hard to find. The landing page doesn't match the ad's promise. | Align content more closely with business goals. Make the link prominent and easy to click. Ensure a seamless user journey from post to landing page. |
| High Clicks, High Bounce Rate | People are interested enough to click, but they leave your website almost immediately. | The landing page is slow to load. The website content doesn't deliver on the ad's promise. The site has a poor user experience on mobile. | Optimize landing page speed. Ensure messaging is consistent between the ad and the page. Check and improve your site's mobile responsiveness. |
| Engagement Spikes on Specific Days | Your audience is most active and receptive at certain times. | Your audience's schedule (e.g., active during lunch breaks or evenings). Posts coincide with relevant external events. | Analyze your data to identify peak engagement times. Use a scheduler like EvergreenFeed to post consistently during these windows. |
| Declining Reach Over Time | Your content is losing visibility, potentially due to algorithm changes or audience fatigue. | The algorithm prioritizes different content types. Your content has become repetitive. Increased competition in the feed. | Diversify your content formats (e.g., video, Reels, Stories). Refresh your creative strategy. Analyze competitor content for inspiration. |
Ultimately, looking at your data this way means you stop just reacting to numbers and start making strategic moves based on solid evidence. For those who want to dig even deeper, exploring concepts like application analytics for deeper insights can provide even more powerful clues to guide your strategy.
Advanced Strategies for Metric-Driven Optimization
Are you ready to go beyond just looking at your weekly reports? This is where the most effective marketers pull ahead. They use advanced strategies that connect their social media marketing metrics directly to real, long-term business value. It's a shift from just measuring what already happened to understanding what will likely happen next and seeing the full financial story of your efforts.
Tying Social Activity to Revenue
The ultimate goal for any business on social media is to draw a clear line from a post, ad, or interaction to a sale. It’s not as difficult as it sounds. Three key strategies help make this connection clear:
- Customer Lifetime Value (CLV) Attribution: Instead of just tracking a single purchase, this method looks at the total value a customer brings to your business over their entire relationship with you. It then attributes that value back to the social channel that first brought them in. This helps you see which platforms, like LinkedIn or Instagram, aren't just driving one-off sales but are attracting your most valuable, loyal customers.
- Multi-Touch Attribution: Think about your own buying journey—it's rarely a straight line. You might see a product in a blog post, get a retargeting ad on Facebook, and finally make a purchase after an email reminder. Multi-touch attribution gives credit to each of these touchpoints, showing how different channels work together to guide a customer toward conversion. It paints a more realistic picture of your marketing ecosystem.
- Predictive Analytics: This is like having a crystal ball for your marketing budget. By using your past performance data and machine learning, predictive analytics can forecast how a new campaign might perform. This allows you to estimate the potential ROI before you spend a dollar, helping you make smarter investment choices and set your campaigns up for success from the start.
Developing Custom and Forward-Looking Metrics
Measuring what truly matters often means creating your own yardsticks. This involves looking beyond standard vanity metrics to build a more detailed picture of how your audience behaves and what they value.
A great example is cohort analysis. This technique groups your audience based on when they first connected with you (e.g., all new followers from May) and then tracks their behavior over time. It can reveal if customers acquired during a specific campaign are more engaged or spend more than those from other periods. To get a better grasp of what drives these long-term behaviors, you can explore the different types of social media engagement metrics that feed into this bigger picture.
By combining these advanced strategies, you stop simply reacting to old data. Instead, you begin to proactively shape future results. This transforms your social media from a simple communication tool into a predictable and powerful engine for business growth.
Your Action Plan for Metrics-Driven Success
Theory is one thing, but putting it into practice is what drives real results. Moving from simply understanding social media marketing metrics to actually using them requires a clear plan. This guide will help you turn that knowledge into action, building a system that delivers measurable improvements and demonstrates the value of your work.
Establish Your Foundation
First, you need a starting point. Without a baseline, you can't measure progress. Think of it like marking your current spot on a map before you plan your journey.
- Audit Your Current Metrics: For one month, track your key metrics across all social platforms. Don't make any changes yet—just observe. Record your average reach, engagement rate, click-through rate, and any conversions.
- Identify Quick Wins: Look for obvious gaps in your strategy. Are you overlooking a platform where your audience spends their time? Is a link to your website missing from your profiles? Fixing these small issues can offer immediate, encouraging results and build momentum for bigger changes.
- Set Realistic Baselines: Based on your audit, establish your starting numbers. For example, your baseline might be a 2.5% engagement rate on Instagram and 15 weekly leads from LinkedIn. These are the numbers you'll aim to improve upon.
Create a Cycle of Continuous Improvement
Once your baseline is set, the real work begins. A successful metrics-driven approach isn't a one-time project; it’s a continuous cycle of testing, learning, and refining your strategy.
- Implement Review Cycles: Schedule a specific time each week or month to go over your dashboards. A weekly check-in is great for tracking campaign-specific data, while a monthly review helps you identify broader trends. Consistency is what turns data analysis into a powerful habit.
- Build Stakeholder Buy-In: When you share your results, focus on business impact, not just marketing jargon. Instead of saying, “Our impressions increased by 20%,” frame it as, “We reached 20% more potential customers this month, which led to a 10% increase in website visits.” This connects your social media efforts directly to what leadership values.
- Create Accountability: Assign clear ownership for different metrics. When someone is responsible for a specific outcome, like improving the conversion rate from social ads, they are more likely to find creative ways to make it happen. This ensures your measurement efforts translate directly into better business outcomes.
By following this action plan, you create a system where data isn't just collected—it's used to make smarter decisions. This structured approach builds a powerful feedback loop that consistently improves your performance.
Ready to automate the "doing" so you can focus on the "analyzing"? Sign up for EvergreenFeed for free and let us handle your content scheduling, giving you more time to focus on the metrics that drive growth.