
Social media analytics reports are more than just a summary of likes and follows; they're the bridge between raw social data and genuine business intelligence. When done right, they stop being a simple data-gathering exercise and become a structured story that shows what’s working, justifies your budget, and points the way for your next big campaign.
Moving Beyond Data Dumps to Strategic Decisions
Let's be honest, how many social media reports have you seen that are just a wall of numbers? They get sent around, maybe someone skims them, and then they're filed away, never to be seen again. We need to change that. A well-crafted report isn't just a task to check off a list; it’s a powerful tool for making smarter business decisions that actually drive growth.
The real magic happens when your report tells a story. Instead of just stating that reach increased by 20%, a strategic report explains why. It connects the dots between a specific content series, your audience's reaction, and the ultimate impact on your business goals. This is how you turn a pile of data into a clear narrative about your brand's performance.
From Numbers to Narrative
When you take a strategic approach, your reports can do some heavy lifting. They can prove the value of your marketing spend, help you fine-tune your content strategy, and even give you insights into how customers feel about your brand.
For example, imagine you can show a direct link between the new video series you launched and a sudden spike in website clicks. Suddenly, you're not just asking for more money for video production; you're presenting a data-backed case for it. This kind of storytelling is what separates a routine report from a game-changing strategic asset. If you're looking to dive deeper, you can find great resources on social media metrics and reporting.
A great report doesn't just present data; it interprets it. The goal is to answer the 'so what?' for your stakeholders, turning abstract metrics into concrete recommendations that drive the business forward.
The industry is certainly taking notice. The global social media analytics market was valued at around USD 10.23 billion in 2024 and is expected to explode to nearly USD 43.25 billion by 2030, according to data from Grandviewresearch.com.
This chart really drives home the difference strategic reporting can make.
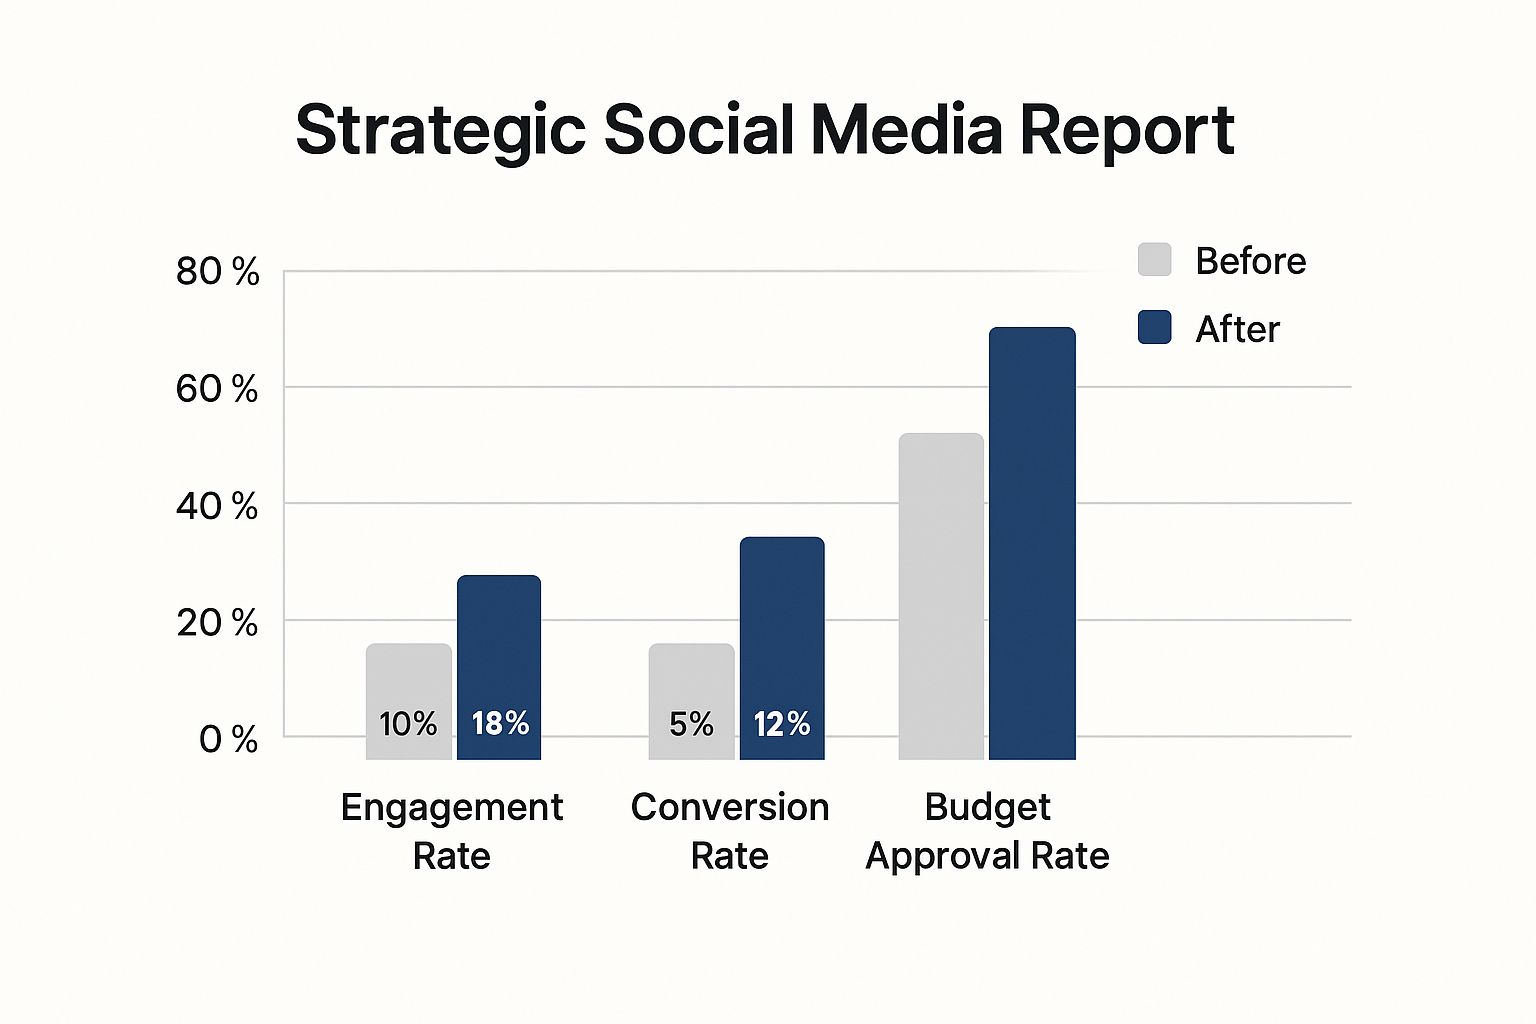
As you can see, shifting from basic data collection to true strategic analysis has a massive impact on the metrics that really matter.
Defining Your North Star with Clear Reporting Goals

Before you even think about logging into an analytics tool, you need to hit pause and ask one simple, yet critical, question: "What am I actually trying to prove or improve here?"
If you can't answer that, your social media analytics reports risk becoming a jumble of vanity metrics. You know the ones—impressive-looking numbers that ultimately don't mean much for the bottom line. The first real step is moving beyond fuzzy goals like "boost engagement" and getting specific about what success actually looks like for your business.
Think of your goals as a filter. They cut through the noise and help you zero in on the data that truly matters. Every goal you set should be a direct line to a larger business objective, whether that’s driving sales, generating qualified leads, or making customers stick around longer. This connection is what transforms social media from a side activity into a core part of your company's growth strategy.
Connecting Goals to Your Business Model
The "right" goals are never one-size-fits-all. What's crucial for a B2B software company is probably irrelevant for a local coffee shop. The real skill is translating those high-level business needs into specific, measurable social media key performance indicators (KPIs).
To get a clearer picture, let's look at a few real-world examples:
- For a SaaS Company: Chasing likes on a LinkedIn post is a waste of time. Their main goal is almost always lead generation. The most important KPI in their report should be something like 'demo request clicks' coming from a campaign's landing page. Everything else is just supporting data.
- For an E-commerce Brand: The name of the game is sales. A key metric would be the conversion rate from Instagram product tags. They need to know exactly how many people who tapped a product in a post went on to buy it.
- For a Local Restaurant: Their goal is putting people in seats. The report should focus on metrics like 'Get Directions' clicks from their Google Business Profile or engagement on posts promoting daily specials to a tightly geo-targeted audience.
Setting clear, business-oriented goals is the difference between reporting on social media activity and reporting on social media impact. One is just noise; the other is your roadmap to success.
Mapping your business goals directly to social media KPIs is the best way to ensure your reports are telling a story that matters to stakeholders.
Mapping Business Goals to Social Media KPIs
| Business Objective | Relevant Social Media KPI | Example Metric to Track |
|---|---|---|
| Increase Brand Awareness | Reach & Impressions | Unique users reached per campaign |
| Drive Website Traffic | Clicks & Click-Through Rate (CTR) | Link clicks from a specific post to a blog |
| Generate New Leads | Conversion & Form Fills | Downloads of a gated e-book from a LinkedIn ad |
| Boost Online Sales | Sales Conversion Rate | Revenue generated from UTM-tagged social links |
| Improve Customer Loyalty | Engagement & Sentiment | Positive mentions and response time to comments |
This kind of mapping forces you to think strategically and prioritize what's important.
For example, a B2B service provider might discover that while their Facebook page gets tons of comments and shares, LinkedIn is where 90% of their qualified leads actually come from. A truly strategic report would spotlight this fact, probably even recommending shifting more ad spend to LinkedIn, despite its lower "engagement" numbers. Without a clear goal of lead generation, that game-changing insight would be buried, and a major opportunity missed.
This is the kind of focused story your social media analytics reports need to tell.
Choosing Your Analytics Toolkit and Core Metrics

Now that you know what you’re trying to achieve, it’s time to pick the right gear for the job. Your analytics toolkit is the bridge between your goals and your results. You’ve got options, from the free, built-in analytics on platforms like Meta and LinkedIn to seriously powerful third-party suites.
The best choice really boils down to your budget, your team's needs, and just how deep you need to dig into the data.
For a lot of people, native analytics are the perfect starting point. They're free, reliable, and give you a decent handle on what’s happening on a single platform. The headache begins when you’re juggling multiple social channels. Constantly switching between dashboards and manually patching together data in a spreadsheet gets old, fast.
This is where dedicated analytics tools really earn their keep. Platforms like Sprout Social or Hootsuite pull all your data into one central hub. This not only saves you a ton of time but also lets you compare performance across channels in a way you just can't do with native tools alone. If you're looking to build something truly powerful, you should also check out our guide to creating the perfect social media dashboard.
Native Analytics vs. Third-Party Tools
So, which path should you take? It's usually a classic trade-off: cost versus capability.
-
Native Tools (e.g., Meta Business Suite, LinkedIn Analytics):
- Pros: The big one is that they're 100% free. The data also comes straight from the source, so you know it’s accurate for that specific platform.
- Cons: You can't compare apples to oranges (or Instagram to Twitter) easily. Customization is limited, and building a comprehensive, multi-channel report is a manual, time-consuming slog.
-
Third-Party Tools (e.g., Agorapulse, Sprout Social):
- Pros: You get a single, unified dashboard for everything. They offer advanced reporting, competitor tracking, and often bundle in other useful features like content scheduling.
- Cons: They come with a subscription fee. This can be a hurdle for small businesses or freelancers just starting out.
Many advanced tools are now using AI to deliver sharper insights, making that investment pay off even faster. The market for these tools is growing quickly, with North America holding about 33% of the market share as companies double down on using analytics for smarter consumer targeting. You can read more about this trend from IMARC Group.
Selecting Metrics That Actually Matter
With your tools ready to go, the next step is focusing on the right numbers. It's easy to get overwhelmed by all the available data. My advice? Don't. Instead, anchor your entire report to just a few core metric categories that tie directly back to your goals.
The goal isn't to track every metric available. It's to select the few that directly reflect progress toward the specific business objectives you defined earlier.
Start by building your report around these four essential areas:
- Reach & Impressions: This is your top-of-funnel data. It tells you how many eyeballs are seeing your content and is a fundamental measure of brand awareness.
- Engagement Rate: This is where you see if your content is actually hitting the mark. We're talking likes, comments, shares, and saves. High engagement means your audience is connecting with what you're putting out there.
- Conversion Rate: This is the money metric. It tracks how many people took the action you wanted them to, whether that's clicking a link, signing up for a newsletter, or buying a product. It’s the clearest line between social media effort and business results.
- Audience Growth: This one’s straightforward—it’s the speed at which your follower count is growing (or shrinking). It’s a key health indicator for your online community.
Let's put this into practice. Say you’re launching a new product. Instead of obsessing over likes, you should be laser-focused on your share rate. A share is a powerful endorsement. It means someone found your content so valuable they were willing to put their own name on it and pass it along to their network. That's how you get organic reach and a real signal of a successful launch.
Turning Raw Numbers Into a Story That Matters

Let's be honest, raw data is just a pile of numbers. It's the story you wrap around those numbers that gives them meaning. The best social media analytics reports I've ever seen are less like spreadsheets and more like compelling narratives. They don’t just present facts; they guide stakeholders from the "what" (the numbers) to the "so what" (the actual insights).
The trick is to structure your report like you're building a case. Start with your most important findings right up front, then use the rest of the report to present the evidence. This makes it incredibly easy for even the busiest executive to get the gist immediately.
Lead With a Punchy Executive Summary
Before you get lost in the platform-specific details, always, always start with an executive summary. This isn't just a fluffy intro; it's the entire story in a nutshell. It should be strong enough to stand on its own, giving a reader the key findings, insights, and your top recommendations in just a few sentences.
A great summary gets straight to the point. For example: "Our recent shift to Instagram Carousels drove a 25% increase in engagement this month, which also contributed to a 10% lift in website traffic. Based on this, we should reallocate some of our video budget to produce two more carousel posts each week to really lean into this momentum."
See? That one paragraph tells them the result, the reason, and the next step. Simple and powerful.
After that killer opening, the rest of the report can flow naturally. I've found this structure works well for clarity:
- Overall Performance Snapshot: The high-level KPIs across all your channels.
- Deep Dives by Platform: A dedicated section for Instagram, then TikTok, LinkedIn, and so on.
- Specific Campaign Results: How did that targeted initiative or ad campaign actually do?
- The "Why" – Key Learnings: This is where you explain what’s behind the numbers.
- Your Action Plan: Exactly what you're going to do next based on what you've learned.
Use Visuals to Make Your Point, Fast
We're all visual creatures. A single, well-chosen chart can slam a point home faster than a dense paragraph of text ever could. But the key is using the right chart for the job. The wrong one just creates confusion and undermines your entire narrative.
Think of it this way—match the visual to the data:
| To Show… | Use This Chart… | Because It's Great For… |
|---|---|---|
| Comparisons between items | Bar Chart | Instantly showing which content pillar or platform performed best against others. |
| A trend over a period | Line Chart | Clearly tracking metrics like follower growth or engagement rate month-over-month. |
| Parts of a whole | Pie or Donut Chart | Breaking down your audience demographics or traffic sources into clean percentages. |
The point of a chart isn't just to make a report look pretty. It's to make the data instantly understandable. A good visual should make your point for you, removing any need for guesswork.
Add That Layer of Context and Insight
This is the part that separates a good report from a truly great one. Simply stating "engagement went up 15%" is just spitting out data. Real analysis is explaining why it happened. This is your moment to connect the dots and show your strategic value.
Instead of just the number, frame it with an insight. Try this: "We saw a 15% lift in our engagement rate in October, almost entirely driven by the 'Behind the Scenes' video series we launched on Instagram Reels. This content clearly hit home, generating 3x more comments than our usual product posts. It’s a strong signal that our audience is craving more of this authentic, human-centric content."
That small addition completely changes the game. It transforms a boring stat into a powerful insight, shows you understand what makes your audience tick, and provides a clear path forward. This is how you build a narrative that actually gets people to listen and act.
Turning Data into Decisions: How to Craft Actionable Recommendations
This is where the rubber meets the road. So far, you've wrangled the data and told a story with it. Now it's time to make that story matter by turning your observations into a concrete plan that actually moves the needle.
Let's be honest: a report without recommendations is just a history lesson. A great report is a roadmap for the future. This means you need to connect the dots between what the numbers are telling you and what your team should do next. It all starts with putting your data into context.
Find the Story by Comparing Your Data
The most powerful insights rarely come from looking at numbers in a vacuum. Context is everything. The real magic happens when you start looking at data side-by-side.
First, compare your content formats against each other. How are your videos performing compared to static images? You might discover that your Instagram Reels get 2x the reach, but carousel posts are quietly driving way more saves and website clicks. This tells you that different formats are hitting different goals.
Next, look at performance over time. How does this month stack up against last month? Even better, how does it look compared to the same month last year? That year-over-year view is critical because it helps you see past seasonal lulls or spikes and identify genuine growth.
These comparisons are crucial for spotting patterns. In fact, companies across all sectors, from retail to banking, are using social data analysis for everything from improving customer service to managing risk, as highlighted by Stellar Market Research's analysis of social media analytics adoption.
My Two Cents: An insight is the "what" – a pattern you've spotted by comparing data. A recommendation is the "so what" – the specific action you propose to either repeat a success or fix a problem based on that insight.
A Simple Framework for Killer Recommendations
Once you've nailed down a solid insight, you need to translate it into a clear, direct action. I’ve always relied on a simple "Insight-to-Recommendation" framework to keep things from getting fuzzy. This makes sure every recommendation is tied directly to the evidence in your report.
Here’s what it looks like in the real world:
- Insight: "Our Instagram Stories using the poll sticker are getting 3x the engagement of our standard feed posts. It looks like our audience is craving interactive content."
- Recommendation: "Let's reallocate 20% of our content budget to create two new interactive Story series next quarter to lean into this engagement trend."
See how that works? It’s not just a vague "let's do more Stories." It quantifies the action and provides the "why," making it a no-brainer for stakeholders to get behind.
Here's another one for a B2B brand:
- Insight: "Our LinkedIn text-only posts that ask a direct question are generating a 40% higher comment rate than posts linking to our blog."
- Recommendation: "We should launch a weekly 'Question of the Week' text-only post on LinkedIn to spark more community conversation and boost our organic reach."
Ultimately, you want every recommendation to feel like the logical next step based on the data you just presented. This is how your social media analytics reports stop being a passive summary and become an active tool for growth. It's also the first step in proving the value of your work, which is fundamental to figuring out your return on investment. You can dig deeper into that with our handy social media ROI calculator.
Unpacking the Common Questions About Social Media Reporting
Even after years in the trenches, certain questions about social media reporting pop up again and again. It's completely normal. Let's walk through some of the most common ones I hear from other marketers so you can get past these hurdles and start building reports with total confidence.
How Often Should I Be Pulling Reports?
This is probably the number one question, and the honest answer is: it depends entirely on what you're trying to achieve. There's no single "right" answer, but there are some solid best practices to follow. For most teams, a comprehensive monthly report is the gold standard. It gives you enough data to see real patterns emerge and is perfect for keeping leadership in the loop.
If you're in the middle of a big campaign launch, waiting a full month is way too long. In that case, a quick weekly check-in is your best friend. It lets you spot what’s working (and what’s not) quickly enough to make smart adjustments on the fly.
My advice? Steer clear of daily reporting. It's a classic rookie mistake. Daily numbers fluctuate wildly, and obsessing over them often leads to knee-jerk decisions. You'll end up chasing ghosts instead of focusing on the long-term trends that actually move the needle.
So, what's the right cadence for you?
- Weekly: A must-have for teams running active campaigns. Think of it as your in-the-moment tactical checkup.
- Monthly: The perfect rhythm for most businesses. This is your go-to for tracking overall progress against goals and keeping stakeholders informed.
- Quarterly: This is where you zoom out. Use quarterly reports for high-level strategic reviews and to plan your roadmap for the next three months.
Are Vanity Metrics Actually Useless?
Ah, the "vanity metrics" debate. We're talking about numbers like follower count or page likes—the ones that look great on paper but don't directly tie to revenue. So, should you just ignore them? Not exactly.
Think of them as one piece of a much larger puzzle. A growing follower count can be a fantastic signal of growing brand awareness, which is a perfectly valid marketing objective. The mistake is letting these metrics stand alone in your social media analytics reports. You have to give them context.
For instance, don't just report on follower growth. Pair it with your engagement rate. This immediately tells a more interesting story: are you just collecting followers, or are you building a community that actually cares about what you have to say? A huge spike in followers followed by a nosedive in engagement is a major red flag—it might mean you're attracting the wrong audience.
How Do I Actually Measure Social Media ROI?
This is the big one, the question that separates good social media managers from great ones. How do you draw a straight line from a tweet or a post to actual money in the bank? You can't rely on guesswork; you need to connect your social activity to real business outcomes.
The most reliable way to do this is by using UTM parameters. These are just little tracking tags you add to the end of your URLs. When someone clicks a link with a UTM tag, it tells your website analytics tool exactly where that person came from.
Once you have that data flowing into a platform like Google Analytics, you can see that a specific LinkedIn post didn't just get 150 clicks—it generated 5 qualified demo sign-ups. If those sign-ups are worth more than what you spent on that campaign, you've just calculated a tangible, undeniable return on investment. That’s how you prove your work has real business value.
Ready to automate your content and get back hours of your day? EvergreenFeed automates your social media scheduling so you can focus on strategy, not spreadsheets. Start your free trial today and put your content on autopilot.