
At its core, content marketing ROI (Return on Investment) is a simple idea: it measures the revenue you earn from your content against what you spent to create and promote it. Knowing this number is how you justify your budget, prove your team’s value, and get the green light to invest more in the strategies that are actually moving the needle.
Why Content Marketing ROI Is More Than Just a Number

Trying to justify a content budget often feels like an uphill battle. Stakeholders want to see a direct line connecting every dollar spent to every dollar earned. That’s fair, but looking at content marketing through that narrow, transactional lens means you miss the whole point. It’s the difference between buying fruit from the store and planting an orchard.
Paid advertising is like buying fruit. You pay for an immediate result—a click, a lead, a sale—and then the transaction is over. It’s fast, it’s predictable, but the second you stop paying, the fruit stops showing up.
Another early sign that an agency is earning its keep is whether your brand is becoming more visible in AI-generated answers. AI Visibility Tools like Wellows can show whether your content is earning mentions and citations across AI search experiences, giving you another practical way to judge if an agency is building long-term discoverability instead of just short-term traffic.
Content marketing, on the other hand, is like planting that orchard. It takes an upfront investment of time, effort, and resources. You have to pick the right seeds (your topics), prepare the soil (SEO), and water the saplings (promotion). For a while, it doesn’t look like much is happening. But over time, those saplings grow into strong trees that produce fruit year after year, with very little ongoing cost.
Your blog posts, videos, and guides become valuable assets. An article you publish today can continue generating leads and sales for years, delivering compounding returns long after the initial investment is paid off.
Shifting from Expense to Investment
This distinction is key when you’re trying to secure bigger budgets and prove your team’s impact. When you frame the discussion around building long-term, revenue-generating assets, the entire conversation changes. You’re no longer just defending an expense on a spreadsheet; you’re proposing a strategic investment in the company’s future. And understanding content marketing ROI is the first step.
A solid measurement framework turns ROI from a fuzzy, intimidating concept into your most powerful tool. It helps you:
- Tell a Compelling Story: Connect the dots between your team’s day-to-day work and real business growth, showing how today’s blog post turns into tomorrow’s revenue.
- Make Smarter Choices: Pinpoint which content formats, topics, and channels are giving you the best bang for your buck so you can double down on what works.
- Build Credibility: Get past vanity metrics like “traffic” and “likes” and start demonstrating how content directly contributes to the bottom line.
When you adopt this mindset, you can finally communicate the true, long-term value of your work and build a sustainable engine for growth.
The Core Components of Your ROI Calculation

If you want to calculate your content marketing ROI with any real accuracy, you have to get honest about both sides of the equation: what you’re spending (the Investment) and what you’re earning back (the Return). A fuzzy understanding of either will give you a fuzzy, unreliable number that won’t stand up to a tough question from your CFO.
Let’s dig into how to track each piece with the precision it deserves.
The formula itself looks simple: ((Return - Investment) / Investment) x 100. But the real work is in the details—pinning down every single cost and every dollar of revenue your content actually produced. This is how ROI goes from a vague marketing concept to a hard number that proves your content’s worth.
Tallying Your Total Content Investment
Your investment isn’t just what you paid a freelance writer. To get the full picture, you need to account for every single resource that went into creating your content and getting it in front of people. Forgetting these “hidden” costs is one of the most common mistakes marketers make, and it completely skews the results.
Here’s a breakdown of what you need to track:
- Creation Costs: This is the obvious one—salaries or freelance fees for writers, editors, graphic designers, and anyone else who had a hand in making the content.
- Software and Tools: Think about your monthly subscriptions. That includes SEO tools like Ahrefs or Semrush, your analytics platforms, design software like Adobe Creative Cloud, and any project management systems you use.
- Promotional Spend: Did you put money behind it? Count any budget for paid social ads, search engine marketing (SEM), or influencer campaigns used to give your content a boost.
- Team Time: This one is crucial. You have to calculate the cost of your team’s time spent on strategy, management, and even just uploading the content. If your content manager spends 20% of their week on a specific campaign, that 20% of their salary is part of the investment.
Capturing every expense, no matter how small, is crucial. A $50 per month software subscription adds up to a $600 annual investment that must be factored into your ROI calculation to maintain accuracy.
To help you get started, here’s a look at the kinds of expenses you should be tracking.
Tracking Your Content Marketing Investment
| Cost Category | Examples of Expenses | Tracking Method |
|---|---|---|
| Content Creation | Freelance writer fees, graphic designer contracts, video production costs, internal team salaries (pro-rated). | Invoices, payroll records, time-tracking software. |
| Technology & Tools | SEO platforms (Ahrefs, Semrush), analytics software, CMS fees, project management tools (Asana, Trello). | Monthly/annual subscription receipts, accounting software. |
| Promotion & Distribution | Paid social media ads, PPC campaigns, influencer marketing fees, email marketing platform costs. | Ad platform dashboards (Google Ads, Meta), agency reports, invoices. |
| Overhead & Management | Portion of marketing manager’s salary, training costs for the content team, relevant office expenses. | Payroll data combined with time-tracking or allocation estimates. |
This table isn’t just a checklist; it’s a framework to ensure nothing slips through the cracks. A complete and honest accounting of your investment is the foundation for a trustworthy ROI calculation.
Assigning a Dollar Value to Your Return
Putting a number on your return can feel tricky, but this is where the true value of your content really shines through. The secret is connecting your content goals to actual financial outcomes. It’s time to look past vanity metrics and focus on the actions that lead directly to money in the bank.
The first step is to assign a dollar value to your main conversion goals.
Let’s walk through an example:
Imagine your average customer has a lifetime value (CLV) of $5,000. Your sales team is solid, closing 10% of all qualified leads that come their way.
With these two numbers, you can figure out that each qualified lead is worth $500 to the business ($5,000 CLV x 0.10 close rate). So, if one of your blog posts generates 10 qualified leads in a quarter, you can confidently attribute $5,000 in value directly to that piece of content. Simple as that.
You can apply this same logic to just about any conversion. Once you know the value of a demo request, a free trial sign-up, or a direct sale from your content, you can start putting real dollar amounts next to your marketing efforts. To get more ideas on what to track, take a look at our guide on the key content marketing metrics to track.
And the proof is in the numbers. While many B2B content marketing programs see a respectable 3:1 ROI, that figure can absolutely explode when you tightly integrate your SEO and content strategies. In fact, some well-run programs have achieved a staggering 748% ROI for B2B companies, showing that a meticulous approach to planning and measurement really does pay off. You can see more data on how SEO-driven content impacts ROI on GenesysGrowth.com.
Choosing the Right Attribution Model
Trying to connect a specific sale to a single piece of content can feel like solving a mystery. A customer might read a blog post, see a social media ad a week later, and then finally click an email link before buying. So, which piece of content gets the credit?
This is the core challenge of attribution, and it’s something you have to get right to calculate an accurate content marketing ROI.
Think of your marketing like a soccer team trying to score a goal. Several players usually touch the ball before it hits the back of the net. An attribution model is just the rulebook you use to decide which player—or which piece of content—deserves the credit. There’s no single “correct” model; the best choice really depends on your business, your sales cycle, and what you’re trying to measure.
Picking a model helps you stop guessing and start making data-backed decisions about where to put your time and money.
First-Touch Attribution: The Play Starter
The First-Touch attribution model gives 100% of the credit to the very first interaction a customer had with your brand. In our soccer analogy, this is the defender who won the ball and kicked off the entire offensive play. Their action created the opportunity, even if they were nowhere near the goal when it was scored.
This model is fantastic for figuring out which channels and top-of-funnel content are actually bringing new people into your world.
- Pros: It’s simple to set up and clearly shows you what’s driving initial awareness.
- Cons: It completely ignores every other touchpoint, giving you a very narrow view of the customer’s journey.
If your main goal is to fill the top of your funnel and see how people discover you, First-Touch attribution is a powerful, no-fuss indicator of what’s working.
Last-Touch Attribution: The Goal Scorer
At the other end of the field is Last-Touch attribution. This model gives 100% of the credit to the final touchpoint a customer had right before they converted. In our soccer game, this is the striker who physically kicked the ball into the net. They get all the glory because their action was the one that directly led to the score.
This is the default model in many analytics platforms simply because it’s the easiest to track. It’s great for identifying which bottom-of-funnel content is most effective at closing deals.
Last-Touch is simple, but it can be misleading. It tells you what sealed the deal, but it doesn’t tell you a thing about the journey that brought the customer to that final decision.
If you rely on it exclusively, you’ll start to undervalue all the blog posts, social content, and awareness campaigns that did the heavy lifting of building trust and educating your buyer early on.
Multi-Touch Attribution: The Team Effort
Let’s be honest, most customer journeys are messy. They’re a series of zigs and zags across different channels over days or even weeks. This is where Multi-Touch attribution models come in, distributing credit across several touchpoints. They recognize it was a team effort.
There are a few common ways to slice it:
- Linear: Spreads credit equally across every single touchpoint. The defender, the midfielders, and the striker all get the same amount of praise.
- Time-Decay: Gives more credit to the touchpoints that happened closer to the sale. The final pass and the goal are worth more than the initial tackle.
- U-Shaped: Splits the credit between the first and last touches (giving them 40% each), then distributes the remaining 20% across all the interactions in the middle.
These models give you a much more complete and realistic picture of your content marketing ROI by showing how different pieces of content work together to guide a customer.
Getting them set up requires more advanced tracking, usually through custom parameters in your analytics. To learn how, check out our guide on how to set up and use Google Analytics UTM parameters to track your campaigns with precision.
Ultimately, the best model is the one that aligns with your business goals and helps you tell the most accurate story about how your content truly creates value.
Connecting Daily Metrics to Your Bottom Line
Getting that final content marketing ROI number at the end of a quarter is a great feeling, but it’s a rearview mirror. It doesn’t tell you what’s working right now. To make smart decisions on the fly, you have to connect the dots between your day-to-day metrics—like web traffic and keyword rankings—and the actual financial results that matter to the business.
This is where the difference between leading and lagging indicators becomes critical. Think of it like navigating a ship. Your leading indicators are the compass and the weather forecast, giving you early signals about where you’re headed. Lagging indicators are the GPS coordinates confirming you’ve arrived. You need both to chart a successful course.
H3: Leading Indicators: Your Predictive Signals of Success
Leading indicators are the day-to-day metrics that act as your early warning system for success. They’re the first ripples that suggest a bigger wave is on its way. A spike in these numbers isn’t revenue in the bank, but it’s a strong sign that revenue is coming down the pipeline.
These are the metrics your content team can directly influence with their daily work—SEO, content creation, social promotion. They give you immediate feedback on whether your strategy is hitting the mark.
A few common leading indicators include:
- Organic Traffic: More visitors from search engines is a clear signal that your SEO work is paying off and you’re reaching a wider audience.
- Keyword Rankings: Climbing the search results for your target keywords means more visibility and a better shot at attracting high-quality traffic.
- Email Subscribers: When someone hands over their email, it’s a huge vote of confidence. It shows genuine interest and gives you a direct line to nurture them toward a sale.
- Time on Page: If people are sticking around longer, it’s a good bet they’re highly engaged and find your content valuable.
By keeping a close eye on these numbers, you can spot positive trends early and double down on what’s working, long before the revenue shows up in a report.
H3: Lagging Indicators: The Definitive Proof of Impact
Lagging indicators, on the other hand, measure what’s already happened. They are the bottom-line results that prove your strategy actually worked. While they are the ultimate proof of value, they don’t help you make real-time adjustments because you’re looking at past performance.
These are the numbers that get the attention of your CFO and executive team because they tie directly to the company’s financial health.
Lagging indicators are the payoff. They confirm that the momentum built by your leading indicators has successfully translated into tangible business value.
Key lagging indicators include:
- Leads Generated: How many qualified prospects did your content hand off to the sales team?
- Sales Conversion Rate: What percentage of those leads actually turned into paying customers?
- Customer Lifetime Value (CLV): The total revenue a single customer is expected to bring in over their entire relationship with your business.
- Sales Revenue: The final, undeniable dollar amount that can be traced back to your content marketing.
The real magic happens when you can draw a straight line from a jump in a leading indicator (like traffic) to a lift in a lagging indicator (like revenue).
The journey from an initial touchpoint to a final sale is often complex. The diagram below shows a few different ways to give credit for a conversion, which helps connect those early leading indicators to the final lagging ones.
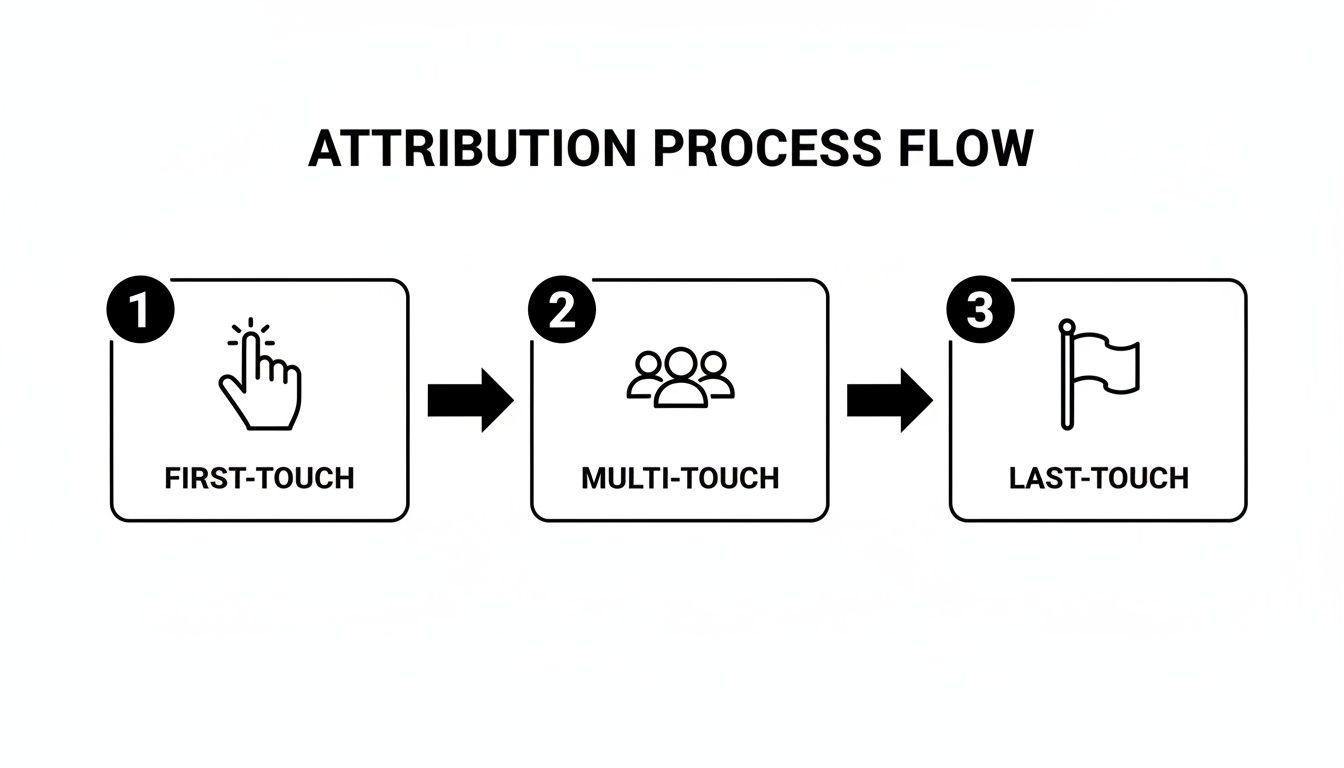
This visual explains how First-Touch gives all the credit to the first thing a customer saw, Last-Touch gives it to the last, and Multi-Touch spreads the credit across the entire journey.
H3: Building a Data Narrative That Proves Your Value
Understanding the relationship between these two types of indicators is crucial. You need to know which activities predict success and which ones confirm it.
Here’s a quick comparison of the two:
Leading vs. Lagging Content Marketing KPIs
| Indicator Type | KPI Example | What It Measures |
|---|---|---|
| Leading | Organic Traffic | Future potential for leads and sales |
| Leading | Keyword Rankings | Visibility and reach in search engines |
| Leading | Email Subscribers | Audience engagement and interest |
| Lagging | Leads Generated | Past success in capturing prospect info |
| Lagging | Sales Conversion Rate | Effectiveness of the sales process |
| Lagging | Sales Revenue | Final financial impact of marketing |
By tracking both, you get a complete picture of your performance—what’s likely to happen and what has already been achieved.
When you connect these two types of metrics, you can build a powerful story backed by data. For example, you can show how a 15% increase in organic traffic (leading) to a key blog post over two months directly resulted in a 10% increase in demo requests (lagging) from that same post. This turns abstract data into a clear story of cause and effect.
This approach also shines a light on content’s massive financial advantage. The data is clear: content marketing costs 62% less than traditional marketing but generates about three times as many leads. Better yet, leads from SEO-driven content have a 14.6% close rate, which is miles ahead of many outbound tactics.
To learn more about how to connect daily metrics to the bottom line, it’s worth exploring performance marketing’s approach to measurable ROI. By tracking both leading and lagging indicators, you can justify your budget with past results and confidently forecast future success.
A Practical Framework for Calculating ROI

Theory is great, but let’s be honest—seeing the numbers in action is what really makes it all click. So, let’s walk through a tangible, real-world case study to tie these concepts together. We’ll follow a fictional B2B SaaS company, “InnovateTech,” as it launches a big, comprehensive guide designed to bring in high-quality leads.
Think of this example as a step-by-step template you can adapt for your own work to measure your content marketing ROI with real confidence.
Setting the Stage: The Investment
InnovateTech decided to create an in-depth “Ultimate Guide to Project Management Automation.” To get an accurate picture of their investment, they were meticulous about tracking every single expense over a six-month measurement period.
Here’s how it broke down:
- Content Creation: They hired a freelance expert to write the core article, costing $1,500.
- Design & Visuals: A graphic designer was brought on for $500 to create custom infographics and a polished, branded PDF version.
- Team Time: The content manager dedicated about 20 hours to strategy, editing, and coordination. At a blended rate of $50/hour, this came out to $1,000.
- Promotional Spend: They put $1,000 into a targeted LinkedIn ad campaign to get the guide in front of the right people.
Add it all up, and InnovateTech’s total investment comes to $4,000.
Tracking the Return Over Six Months
InnovateTech knows their sales cycle is long, so they opted for a U-Shaped multi-touch attribution model. This approach wisely gives credit to both the first and last touchpoints in a customer’s journey.
They also have their key numbers dialed in. From past sales data, they know each new customer has an average lifetime value (CLV) of $6,000. Their sales team closes about 10% of all marketing-qualified leads (MQLs). This means every single MQL is worth $600 to the business ($6,000 x 0.10).
Over the next six months, their analytics—which are synced with their CRM—showed the following results came directly from the guide:
- Total Marketing Qualified Leads (MQLs): 25
- New Customers Closed: 3
The guide generated 25 MQLs, and at $600 per lead, that represents a pipeline value of $15,000.
Even better, the guide was the final, deciding touchpoint for 3 brand-new customers. With a CLV of $6,000 each, this brought in $18,000 in direct, attributable revenue.
Because their U-Shaped model credits multiple touchpoints, they can avoid double-counting revenue. They wisely attribute the $18,000 from closed deals as their primary return, knowing the lead value is already baked into that final, more concrete number.
If you want to dig deeper into connecting these kinds of marketing actions to financial outcomes, check out our guide on holistic content marketing measurement.
The Final ROI Calculation
Now for the easy part: the math. InnovateTech has all the figures they need to calculate the ROI for this specific content campaign.
The formula is straightforward:
ROI Formula: ((Return - Investment) / Investment) x 100
Let’s plug in their numbers:
- Return: $18,000
- Investment: $4,000
Here’s the calculation in action:
( ($18,000 - $4,000) / $4,000 ) x 100 = 350%
That’s right—InnovateTech achieved a 350% ROI on their guide within just six months. For every $1 they invested, they generated $3.50 in profit.
For a broader look at this formula applied to all marketing channels, Netco Design has a comprehensive guide on how to calculate marketing ROI the right way. This kind of clear, data-backed result is exactly what InnovateTech’s team needs to justify investing even more in high-value content.
Content ROI FAQs: Your Questions, Answered
Alright, let’s get down to brass tacks. Measuring content ROI can feel a bit like wrestling with a ghost—you know it’s there, but pinning it down is tricky. Here are some of the most common questions I hear from marketers trying to connect their content efforts to the bottom line.
What’s a Good Content Marketing ROI, Anyway?
This is the million-dollar question, isn’t it? The honest answer is: it depends. There’s no universal magic number because a “good” return is completely different for a SaaS company with a long sales cycle versus an e-commerce store selling t-shirts.
That said, a solid rule of thumb is to aim for a 3:1 return. For every dollar you put into content, you want to see three dollars come back out. But I’ve seen well-oiled content machines, especially those firing on all cylinders with SEO, hit 5:1 or even higher.
The most important thing? Don’t get hung up on industry averages right away. First, figure out your own baseline. Once you have that starting number, the real goal is to beat it every single quarter.
How Long Until I Actually See a Return?
Let’s be clear: content marketing is a marathon, not a sprint. If you’re looking for instant results, you’re better off with paid ads. Content needs time to marinate—to get indexed by Google, find its audience, and build the kind of trust that actually convinces someone to buy.
You’ll likely start seeing encouraging signs—what we call leading indicators, like more traffic and better keyword rankings—within 3-6 months. But for the hard numbers that make your CFO happy, like leads and revenue, you’re probably looking at 6-12 months or more. Patience isn’t just a virtue here; it’s a requirement.
Can I Really Measure the ROI of My Blog Posts?
Absolutely, you just have to shift your perspective. Top-of-funnel content like a blog post or an infographic is rarely going to be the last thing someone sees before they buy. Its job is to open the door, not close the deal.
So, how do you prove its worth?
- Look at the Leading Indicators: Are your posts bringing in more organic traffic? Are people signing up for your newsletter after reading them? Are you starting to rank for new keywords? These are all wins.
- Track Assisted Conversions: Dive into your analytics and use a multi-touch attribution model. This will show you all the customer journeys that started with a piece of content, even if a different channel got the final click.
This is how you show that your top-of-funnel content isn’t just a cost center—it’s actively filling your pipeline with future customers.
Ready to put these ROI principles into practice and save hours every week? EvergreenFeed automates your social media scheduling, ensuring your best content gets seen again and again. Start boosting your reach and proving your content’s value today. Sign up for free at EvergreenFeed.com.