
So, what exactly is content marketing measurement?
It's the process of tracking, analyzing, and ultimately reporting on how your content is performing. But it goes much deeper than just checking likes and shares. Real measurement connects every blog post, video, and social update you publish directly to the business objectives that matter. It's about proving the value and return on investment (ROI) of your efforts.
Aligning Content Metrics With Business Goals

Here’s a hard truth: effective measurement starts long before you even glance at a dashboard. It all begins with one fundamental question: "What are we actually trying to achieve as a business?"
Without that clarity, you’re just swimming in a sea of data that might look impressive on the surface but offers zero strategic direction. Your content's success shouldn't be judged by vanity metrics. It has to be judged by its tangible contribution to the company's bigger goals.
This means every single piece of content you create needs a clear purpose tied to a specific business outcome. Whether you're trying to boost brand awareness, generate qualified leads, improve customer retention, or position your company as a thought leader, your metrics have to reflect that mission.
From Vague Goals to Concrete KPIs
The most critical step in this whole process is translating those broad business objectives into specific, measurable Key Performance Indicators (KPIs). This is where your high-level strategy gets real.
A vague goal like "increase brand awareness" only becomes actionable when you break it down into KPIs you can actually track.
For example, how do you really measure "brand awareness"?
- Organic Search Impressions: How many times is your content showing up in search results for relevant, non-branded keywords?
- Direct Traffic: How many visitors are typing your URL straight into their browser? This is a strong signal of brand recall.
- Social Media Reach: What’s the unique number of people who see your content on social platforms?
- Brand Mentions: Are people talking about you? You need to track how often your company is mentioned across the web and social media.
This same logic applies to any goal. If you're pushing for "lead generation," you can't just count the total number of leads. You need to be tracking Marketing Qualified Leads (MQLs) from content downloads, the conversion rates on your landing pages, and the cost per acquisition (CPA) for each lead brought in by a specific content campaign. For a deeper look, check out our guide on essential marketing metrics and reporting.
The most effective teams don't just create content; they create content with intent. Each asset is a tool designed to achieve a specific outcome, and the metrics are simply the feedback mechanism that tells you if the tool is working.
The Power of a Documented Strategy
Connecting content to business goals isn’t just a nice idea—it has a proven financial impact. Research consistently shows that companies with a documented content strategy see a 33% higher ROI than those flying blind.
With the global content marketing market projected to hit an incredible $2 trillion by 2032, being able to measure your effectiveness is no longer optional. A planned approach is what drives real results.
This structured approach ensures you're not just creating content for the sake of it. You're strategically building a library of assets that work together to move the needle on what matters most to leadership and the bottom line. It’s how you transform the marketing department from a cost center into a predictable revenue engine.
Connecting Business Goals to Content KPIs
To make this practical, the table below shows how different high-level business goals can be translated into specific, actionable content KPIs. Think of it as a framework to build your own measurement plan.
| Business Objective | Primary Content Goal | Example Content KPIs |
|---|---|---|
| Increase Brand Awareness | Expand reach and brand recall | Organic Impressions, Direct Traffic, Social Media Reach |
| Generate New Leads | Capture contact information from prospects | MQLs, Gated Content Downloads, Landing Page Conversion Rate |
| Improve Customer Loyalty | Nurture and retain existing customers | Customer Churn Rate, Repeat Visitor Rate, Engagement in Customer-Only Content |
| Establish Thought Leadership | Become the go-to authority in the industry | High-Value Backlinks, Speaker Invitations, Unlinked Brand Mentions |
By clearly defining this connection, you ensure every piece of content you produce has a measurable purpose and a direct line to business success.
Building Your Measurement Toolkit

Once you've nailed down your goals and KPIs, it's time to assemble your toolbox. The trick here isn't to grab every shiny new platform you see. That's a fast track to data overload and "analysis paralysis."
Instead, you want to build a lean, powerful stack that gives you a crystal-clear picture of your performance. Think of it as putting together the right instruments to hear the entire orchestra, not just a single violin.
The Foundational Tools You Can't Live Without
Every solid measurement strategy starts with two free, absolutely essential tools from Google. These are the bedrock for understanding what happens when people land on your digital turf.
- Google Analytics 4 (GA4): This is mission control for your website. GA4 shifts the focus from simple pageviews to user-centric events, giving you a much deeper understanding of the customer journey. You can track everything from how far someone scrolls down a blog post to video plays and form submissions.
- Google Search Console (GSC): If GA4 tells you what users do on your site, GSC tells you how they got there from Google in the first place. It’s your window into organic performance, showing you the exact search queries driving traffic and flagging technical SEO hiccups that might be hurting your rankings.
These two work hand-in-hand. GSC shows you the keywords that brought someone to your article, and GA4 shows you how long they stayed, what they did next, and if they ultimately converted.
Picking the Right Tools for Your Channels
Beyond the basics, you'll need specialized platforms to see what's working on the other channels where you're active. Your toolkit should be a direct reflection of your content strategy.
For instance, email marketing is still a beast for nurturing leads and keeping customers engaged. But to really know if it's working, you have to go beyond open rates. It's worth reading up on how to measure the quality of your newsletter content to see how you can track things like click-through rates on specific links and, most importantly, the conversion rate from your email campaigns.
A common mistake I see is people trying to use a single, all-in-one tool for everything. While some are versatile, you get much deeper, more actionable insights by using specialized tools for social media, email, and SEO.
If social media is a big part of your distribution plan, you absolutely need a dedicated management and analytics tool. Platforms like Buffer, Sprout Social, or Hootsuite consolidate all your data into one dashboard. This makes it so much easier to see which content formats—like videos versus carousels—are hitting the mark on each network, saving you from the tedious job of pulling reports from each platform individually.
Connecting the Dots with Tracking and Attribution
The final layer of your toolkit is all about connecting the dots and proving the value of your work. This is where tracking and attribution come in.
UTM parameters are your best friend here. They are simple bits of code you add to the end of a URL that tell Google Analytics exactly where a visitor came from. Was it that LinkedIn post? That guest blog backlink? That specific link in your newsletter?
By using them consistently, you can finally put a number on your efforts. For a deeper dive, you can learn more about using UTM variables with Google Analytics in our complete guide.
When you thoughtfully choose your tools for analytics, channel monitoring, and attribution, you build a system that doesn’t just collect data—it gives you the insights you need to make smarter content decisions.
From Raw Data to Actionable Insights
Having the data is the easy part. The real work—and where the money is made—is turning all those numbers and charts into a story that tells you exactly what to do next. Raw metrics are just noise until you connect them to actual user behavior and your business goals.
This is how you shift from simply reporting on what happened to truly understanding why it happened. It’s the difference between being a data janitor and a data-driven strategist.
Building Your Central Command Center
One of the biggest mistakes I see is people frantically jumping between a dozen different analytics platforms. They're trying to stitch together a coherent picture from scraps of data, and it's a recipe for disaster. You waste time and, worse, you miss the crucial connections between the data points.
The smarter approach is to build a centralized dashboard. Think of it as your mission control for content performance.
Tools like Google Looker Studio are fantastic for this because they let you pull all your essential KPIs into one visual space. You can build a custom view that includes:
- Website Performance: Key metrics from Google Analytics 4 like Users, Time on Page, and Conversion Rate.
- Search Visibility: Live data from Google Search Console showing Impressions, Clicks, and your average Keyword Positions.
- Social Engagement: Metrics from your social channels to monitor Reach, Shares, and the Click-Through Rates of your latest campaigns.
This unified view helps you spot trends instantly. You'll see right away if that spike in website traffic came from a specific social media post or if a sudden drop in keyword rankings is hurting your lead numbers.
Your dashboard isn't a data graveyard; it's a decision-making tool. If a metric doesn't help you make a smarter choice about what content to create, update, or promote, it doesn't belong there. Keep it clean and focused.
Segmenting Your Audience to Find the Gold
Let's be clear: not all traffic is created equal. Lumping every visitor into one giant bucket is a surefire way to hide your most valuable insights. This is where audience segmentation comes in—it’s the art of slicing your audience into smaller, more meaningful groups based on shared traits.
This is how you uncover the real stories in your data. Instead of just looking at the overall bounce rate for a blog post, you can get much more specific by segmenting by:
- Traffic Source: Are visitors from organic search sticking around longer than those from a paid ad? That tells you a lot about their intent.
- Device Type: Is the user experience on mobile terrible, causing a huge bounce rate for that specific segment? Time to investigate.
- New vs. Returning Users: Do first-time visitors leave right away, while returning users dig in? Maybe you need better content to hook newcomers.
By analyzing these smaller groups, you might find that your in-depth, long-form guides are a massive hit with organic search visitors on desktop but are a total flop with mobile users coming from social media. That single insight is infinitely more useful than just knowing the article's overall time on page.
Mapping the Customer Journey
To really measure content effectiveness, you have to understand how people move through your site. The user flow and path exploration reports in Google Analytics are your best friends here. They literally draw you a map of the journeys people take.
These tools visualize the exact paths users follow from the moment they land on your site. You can finally see which blog post consistently sends people to a product page, or which case study is the final thing people read before they fill out your contact form.
This kind of analysis helps you answer the big questions:
- Where are people getting stuck and leaving?
- What content is actually moving users from awareness to consideration?
- Are people taking unexpected, but valuable, paths through our site?
For instance, you might discover that a top-of-funnel blog post about industry trends is sending a surprising number of people directly to your pricing page. That's a huge tell. It means the content is attracting an audience with high commercial intent, and you should probably double down on that topic cluster. If you're looking to turn raw data into immediate, actionable intelligence, it's worth exploring the principles of mastering real-time data analytics.
This level of analysis isn't just a "nice-to-have" anymore; it's becoming the standard. In 2024, the top metrics marketers tracked were social media and website engagement, proving a clear industry shift toward measuring interaction over vanity metrics. With 41% of marketers now actively measuring their content efforts, a data-driven approach is non-negotiable for staying in the game. By digging into the 'why' behind the numbers, you can confidently decide what to create next.
Calculating Content ROI and Proving Its Value
This is where the rubber meets the road. After all the writing, designing, and promoting, every content marketer eventually faces the big question from leadership: "What are we actually getting for all this?" Answering that isn't about vague metrics like "engagement" or "reach"; it's about connecting your work directly to the bottom line.
Proving the value of your content marketing demystifies its financial impact. It’s how you shift the conversation from marketing being a cost center to it being a reliable revenue driver. Get this right, and you’ll have the data you need to justify your budget, ask for more resources, and earn a strategic seat at the table.
The Basic Formula for Content Marketing ROI
At its heart, the ROI formula is pretty simple. You take the money your content brought in, subtract what you spent to make it, and divide that by your initial investment. We usually show this as a percentage.
Here's the classic formula:
Content Marketing ROI = [(Return – Investment) / Investment] x 100
The math itself isn't the hard part. The real challenge—and where the expertise comes in—is accurately tracking both your "Return" and your "Investment." Nail these two things, and you'll have a credible ROI figure you can confidently stand behind.
The goal isn’t just to spit out a number. It's to build a repeatable system that attributes real revenue back to your content. That system is what gives your ROI calculations the weight they need to actually influence business strategy.
Tallying Up Your Investment
First things first, you need to know exactly what you spent. This is more than just a few obvious line items. To get a true picture of your investment, you have to account for everything.
- Content Creation Costs: This includes any invoices from freelance writers, designers, or video editors. If your team is in-house, you'll need to calculate a portion of their salaries based on the time they dedicated to specific projects.
- Tools and Software: Don't forget the monthly or annual fees for your analytics platforms, SEO tools like Ahrefs or Semrush, and email marketing services.
- Paid Promotion: Any money you put behind promoting your content—whether through social media ads, Google Ads, or sponsored placements—counts toward your investment.
Add all of that up, and you have the "Investment" piece of your ROI puzzle. Being thorough here is non-negotiable if you want an accurate and defensible number.
Attributing Revenue and Calculating Your Return
This is where things can get a little tricky. How do you prove that a specific blog post or webinar led directly to a sale? The answer lies in attribution modeling.
Different models assign credit for a conversion in different ways, and the one you choose depends on what you want to learn.
- First-Touch Attribution: This model gives 100% of the credit to the very first piece of content a customer ever saw. It’s perfect for figuring out which content is best at sparking initial awareness and bringing new people into your orbit.
- Last-Touch Attribution: The opposite of first-touch, this gives all the credit to the final thing a person interacted with before converting. It helps you identify the content that's most effective at closing the deal.
- Multi-Touch Attribution: I find this is usually the most realistic approach. Instead of giving all the credit to one asset, it spreads it across multiple touchpoints in the buyer's journey. It acknowledges the reality that it often takes several interactions to lead to a sale.
Think about it: a customer might find you through a blog post (First Touch), then a month later attend a webinar, and finally click a link in a case study before they make a purchase (Last Touch). A multi-touch model would give partial credit to all three of those pieces.
This is a great visual for how different content formats can contribute to leads, which is the first step toward revenue.
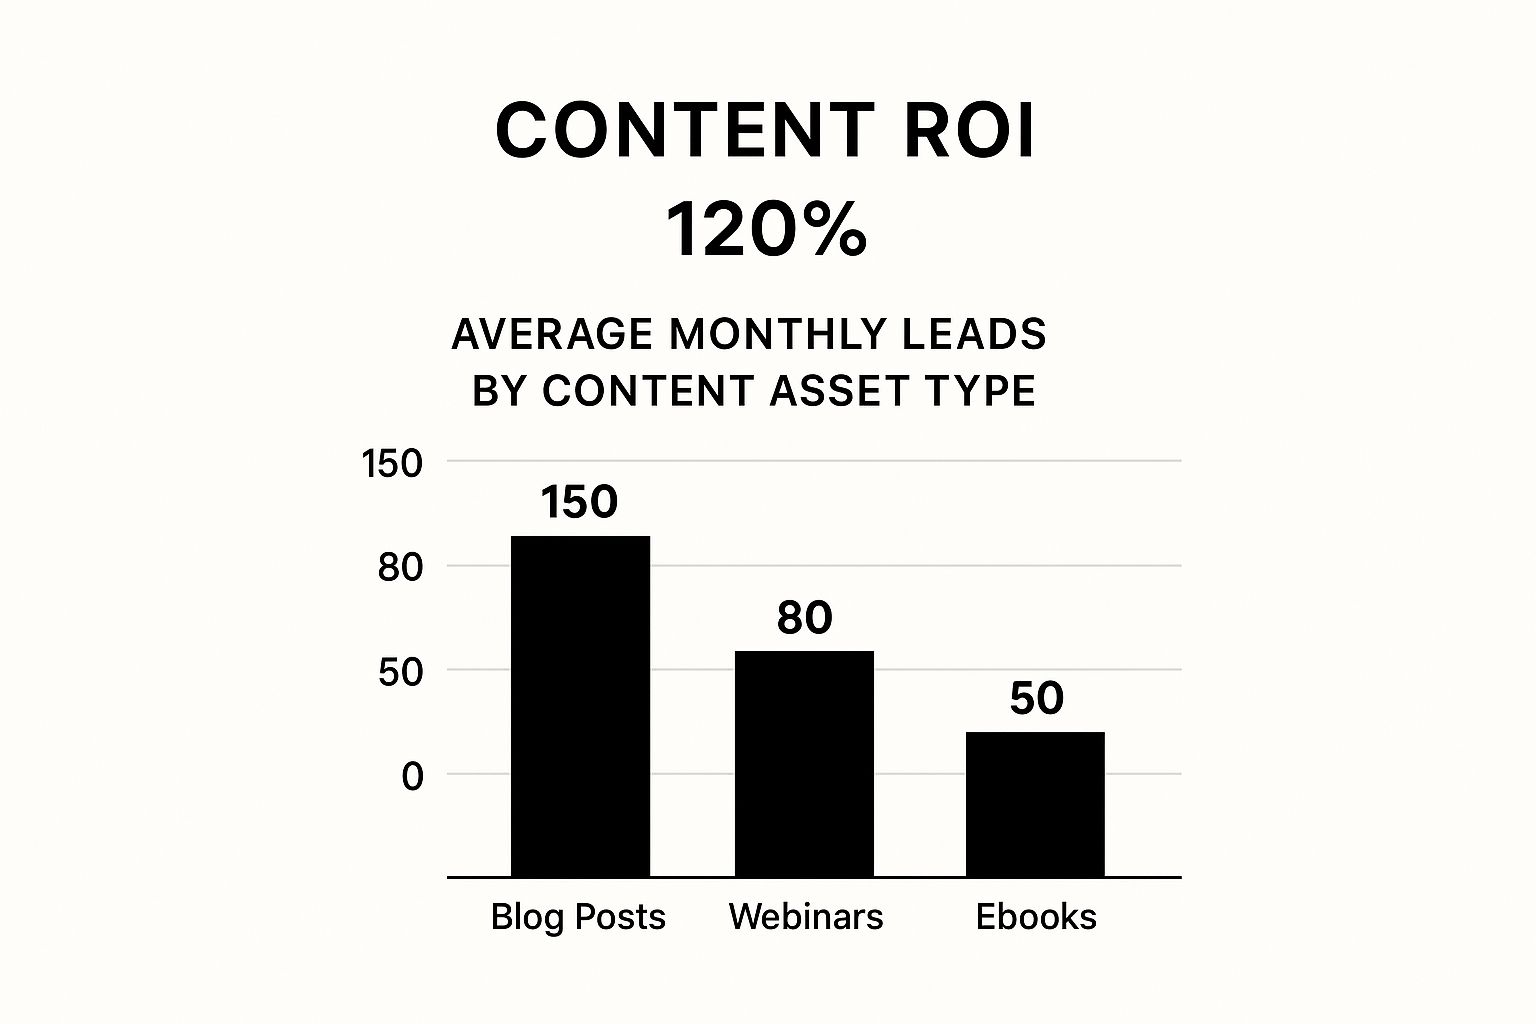
As you can see, blog posts might be the workhorse for lead volume, but a healthy content strategy needs a mix of formats to deliver a strong overall ROI.
To put a dollar value on your return, a great metric to use is Customer Lifetime Value (CLV). Once you've attributed new customers to your content, you can multiply that number by your average CLV to get a solid "Return" figure. For example, if a blog post brought in 10 new customers and your CLV is $2,000, that one post generated a return of $20,000.
If you're focused on social media, the principles are similar, and you can dive deeper into the specifics with a good social media ROI calculator to see how the numbers play out on different platforms.
The table below provides a simple framework to help you start plugging in your own numbers.
Simple Content ROI Calculation Model
| Metric Component | How to Calculate/Find It | Example Value |
|---|---|---|
| Total Investment | Sum of all content creation, tool, and promotion costs for a period. | $5,000 |
| Leads Attributed | Number of new leads from content, tracked via analytics & CRM. | 150 |
| Lead-to-Customer Rate | Percentage of leads that become paying customers (e.g., 10%). | 10% |
| Customers Generated | Leads Attributed x Lead-to-Customer Rate (150 x 0.10). | 15 |
| Customer Lifetime Value (CLV) | Average total revenue a single customer generates over their lifetime. | $1,000 |
| Total Return | Customers Generated x CLV (15 x $1,000). | $15,000 |
| Content ROI | [(15,000 – 5,000) / 5,000] x 100 | 200% |
By combining a crystal-clear investment total with a logical attribution model, you'll be able to calculate—and confidently present—the real financial impact of your content marketing efforts.
Using Insights to Optimize Your Content Strategy

Here’s where the real magic happens. Measuring your content marketing isn't about creating a final report to file away. It’s about building a dynamic, continuous feedback loop that powers your strategy forward.
The insights you gather are the fuel for creating smarter, more agile, and ultimately more successful content. This is how you stop guessing what your audience wants and start giving them exactly what your data proves they value.
Conducting Regular Content Audits
A great place to start is with a systematic content audit. Think of it as a health check for your entire content library. The goal is simple: find your star performers, uncover your hidden gems, and identify the assets that are just taking up space.
During an audit, you’ll want to review everything against the KPIs you set earlier. Specifically, look for:
- Organic Traffic & Keyword Rankings: Which articles are actually pulling their weight in search?
- Conversion Rates: Which posts are bringing in leads or sign-ups?
- Engagement Metrics: Which pieces have the highest time on page or the lowest bounce rate?
- Backlinks: Which assets are naturally earning valuable links from other authoritative sites?
This process will quickly show you what's not working. But don't be too quick to just delete a low-traffic post. The real value is in deciding what to do next.
A content audit isn't about judging past work; it's about maximizing future returns. Every piece of content you've published is an asset, and your job is to figure out whether to improve it, promote it, or retire it.
For an article that’s ranking well but has low engagement, a content refresh could do wonders. Try updating outdated stats, embedding a new video, or just improving its readability with better formatting. If a piece is totally irrelevant or inaccurate, then yes, removing it might be the best call to improve your site’s overall quality.
Using Performance Data to Forecast Your Calendar
Once you know what works, you can build an editorial calendar that’s much more predictable. Your analytics are a goldmine of ideas, pointing you to the exact topics and formats that resonate with your audience.
Look for patterns in your top-performing content. Do your "how-to" guides always outperform your opinion pieces? Does video get way more engagement on social than static images? These aren't just interesting tidbits; they are clear instructions for what to do next.
For example, if you notice that three of your top ten blog posts are about a specific sub-topic, that’s a huge signal to build a topic cluster around it. You could plan a series of related articles, host a webinar, and create an ebook—all interlinked to establish your authority and capture way more search traffic.
This data-driven approach turns your editorial calendar from a simple schedule into a strategic plan for growth.
The Role of AI in Content Optimization
Artificial intelligence is quickly changing how we approach all of this. AI-powered tools can analyze massive amounts of data to spot opportunities a human might miss. They can pinpoint content gaps by comparing your library to what competitors are ranking for, showing you exactly where to create new content to win.
On top of that, AI is becoming essential for personalizing user experiences at scale. It can tailor content recommendations on your website based on a visitor's past behavior, which can dramatically increase engagement and time on site.
The industry is already all-in. Over 80% of marketers are now using AI in some part of their digital marketing. As AI-generated content becomes more common—with 92% of large marketing teams adopting it—the ability to measure its impact on real users will be more critical than ever. You can see more on how marketers are using AI and other content marketing statistics on Typeface.ai.
By combining performance insights with these new technologies, your measurement process becomes more than just a reporting function. It becomes the very engine that drives your entire strategy, ensuring every piece of content has the best possible chance to succeed.
Common Content Measurement Questions
Even with the best plan, you're going to hit some bumps in the road when measuring your content. That’s just part of the process. Getting through these challenges is what separates a good strategy from a great one. Let’s tackle a few of the questions I hear most often.
How Do I Measure Top-of-Funnel Content ROI?
This is the classic content marketer's dilemma. How do you prove the value of a blog post or an infographic that wasn't designed to make a direct sale? It can feel like you're trying to measure the wind.
The trick is to stop looking for a direct line to revenue. Instead, focus on the early indicators that show you're attracting the right people and pulling them into your world. Think of it as tracking the a-ha moments that happen long before someone pulls out their credit card.
Here’s what you should be looking at to prove your top-of-funnel content is working:
- Organic Traffic Growth: Is this piece bringing new eyeballs to your site from search? That's its primary job.
- Keyword Ranking Improvements: Are you starting to show up on Google for the non-branded keywords you targeted? This is a huge win.
- Newsletter Sign-ups: Did someone read your post and think, "I need more of this in my inbox"? That's a strong signal of trust.
- Assisted Conversions: This one is gold. Dig into your analytics to see how many people who eventually became customers read this specific blog post early in their journey. It's the ultimate proof of long-term value.
A top-of-funnel blog post is like the friendly greeting at the door of your store. It might not make the sale itself, but it’s the essential first step that welcomes people in and makes them want to look around.
What Are Vanity Metrics I Should Avoid?
Ah, vanity metrics. They’re the ones that look amazing on a PowerPoint slide but don't actually mean anything for the business. They're all sizzle, no steak, and they can easily distract you from what really matters.
It's all about separating the metrics that track busyness from the ones that track business. For instance, celebrating a huge spike in page views is pointless if your bounce rate is 95%. That just means a lot of people showed up, hated what they saw, and left immediately.
Watch out for these common culprits:
- Social Media Likes: It feels good to get a lot of likes, but they don't pay the bills. They don't tell you if anyone clicked, signed up, or bought.
- Follower Counts: A massive audience is worthless if it's made up of bots, random accounts, or people who will never buy from you.
- Page Views (in isolation): This number is almost meaningless on its own. Without context like time on page or bounce rate, it just tells you that a page loaded.
Instead, anchor your reporting to metrics that speak the language of business, like conversion rate, cost per acquisition, and customer lifetime value. That’s how you show your real impact.
How Often Should I Report on Performance?
Figuring out your reporting rhythm is a delicate balance. You want to keep your finger on the pulse, but you don't want to get lost in a sea of spreadsheets. The right answer really depends on who you're reporting to and what they need to know.
I've always found a tiered approach works best:
- Weekly: This is a quick, internal pulse-check for you and your immediate team. Think of it as looking at a high-level dashboard to spot anything weird or wonderful that just popped up.
- Monthly: Time for a proper review. This is where you dig into your progress against KPIs and use that data to decide what content you’ll create next month.
- Quarterly: This is the big one. It's a comprehensive report for leadership where you connect all your team's hard work directly to business goals and ROI. This is where you tell the story of your strategic value.
This way, everyone from the practitioner to the CEO gets the right information at the right time, making your measurement efforts both efficient and incredibly effective.
Ready to put your evergreen content on autopilot and get more value from every post? EvergreenFeed integrates seamlessly with Buffer to automatically reshare your best content, keeping your social media channels active and engaging your audience around the clock. Start your free trial today and save hours every week.