
When we talk about client engagement metrics, we're looking at the vital signs of your brand's relationship with its audience. It's easy to get fixated on big numbers like follower counts, but those don't tell the whole story. Engagement metrics are the signals that show us how deeply people are actually connecting with what you're putting out there.
Think of it this way: your engagement metrics aren't a scoreboard to show off. They're a compass, pointing your content strategy directly toward what your customers truly care about.
Beyond Vanity Metrics: Why Engagement Matters
Imagine you're at a party. You could be in a huge room packed with people (that's your follower count), but if no one is talking to you, are you really connecting? Vanity metrics like follower counts or page views are just a headcount of who's in the room. They tell you about your potential reach, but not if anyone is actually listening.
On the other hand, genuine client engagement metrics—the likes, comments, shares, and time people spend with your content—measure the actual conversations. These are the people leaning in, asking questions, and adding to the discussion. That's where the real magic happens.
Tracking genuine engagement is the most direct way to understand your audience's interests. It turns marketing from a guessing game into a data-informed dialogue, revealing precisely what content makes your clients feel seen and understood.
Before we dive deep into each metric, let's get a bird's-eye view. This table summarizes the key metrics we'll be exploring, giving you a quick reference for the rest of this guide.
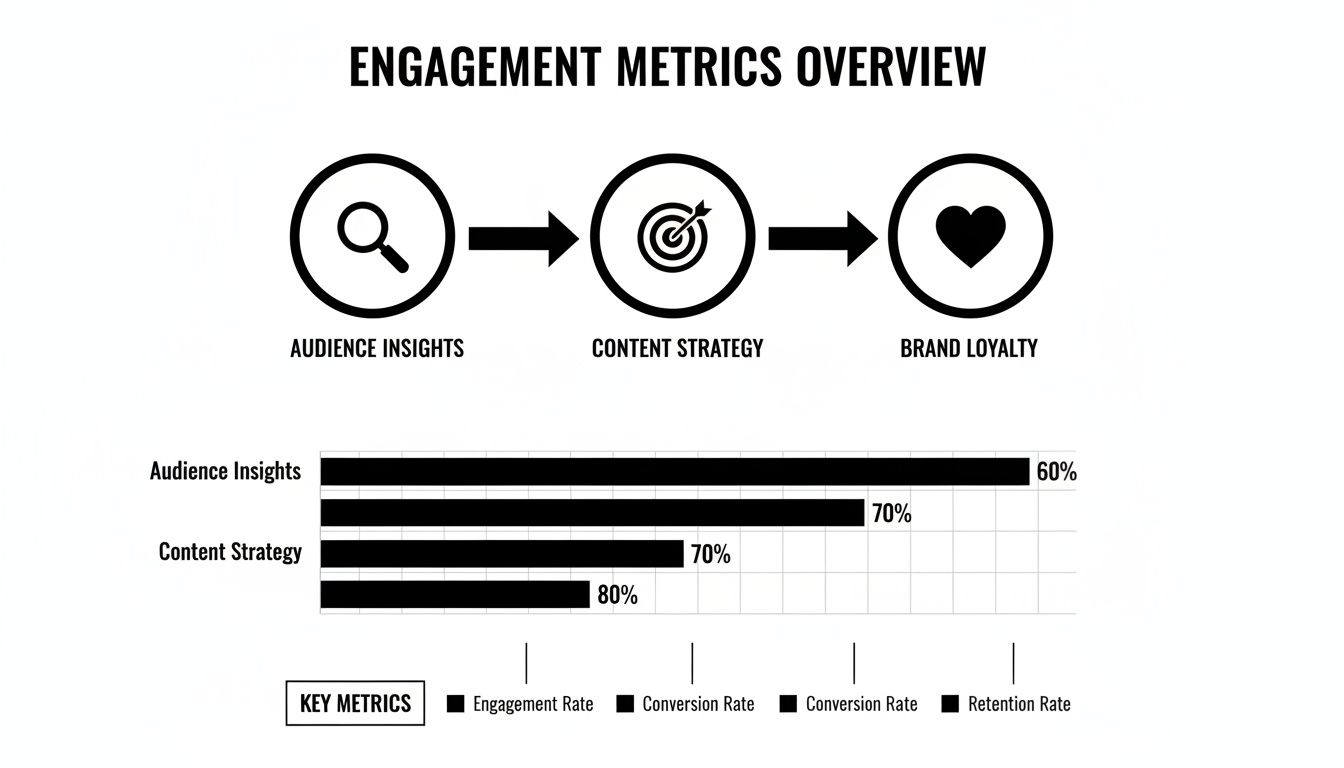
Essential Client Engagement Metrics Overview
| Metric | What It Measures | Why It's Important for Growth |
|---|---|---|
| Engagement Rate | The percentage of your audience interacting with your content. | Shows overall content health and audience interest. |
| Click-Through Rate (CTR) | The percentage of people who click a link in your content. | Indicates how compelling your call-to-action is. |
| Time on Content | The average time a user spends on your page or watching a video. | Reveals how captivating and valuable your content is. |
| Retention Rate | The percentage of users who return to your content over time. | Measures long-term loyalty and audience satisfaction. |
This table is our roadmap. Now, let's explore how each of these pieces fits together to build a powerful engagement strategy.
From Broadcast to Connection
When you start focusing on engagement, your entire mindset shifts. You stop just broadcasting a message and start building a real community. A massive but silent following doesn't do much for your bottom line. A smaller, highly engaged audience, however, can be one of your most powerful assets.
Why? Because these are the people who will:
- Provide priceless feedback: Their comments and questions give you a direct line into their needs and frustrations.
- Become your biggest fans: Engaged followers are way more likely to share your content and recommend you to others.
- Drive real business results: The trust you build through consistent, meaningful interaction is what ultimately leads to conversions and sales.
Paying close attention to these interactions allows you to fine-tune your content strategy, making sure every single post has a purpose. You can confidently create more of what resonates and cut back on what's falling flat, making your efforts much more effective.
Better yet, tools like EvergreenFeed help you set the stage for improving these metrics right from the start. By maintaining a steady flow of high-quality, proven content, you create more opportunities for these valuable conversations to spark, turning passive followers into loyal clients.
Figuring Out What's Working on Social Media
If you really want to know how your social media is doing, you have to look past the vanity metrics like follower count. The real story is in the client engagement metrics—the numbers that show you people are actually paying attention and interacting with what you post.
Think of these metrics as a direct line to your audience, telling you what's landing and what's falling flat.
At the heart of it all is the Engagement Rate. This is the single most important number for gauging the health of your social media community. It measures active participation: the likes, comments, shares, and saves that prove your content is hitting the mark. A high engagement rate is a clear sign that your audience finds what you're sharing genuinely useful, interesting, or entertaining.
Calculating it is simple enough. Just take the total number of interactions on a post, divide it by your follower count (or, for a more accurate take, by the post's reach), and multiply by 100. That gives you a nice, clean percentage.
The Other Numbers That Matter
While engagement rate is the star, a few other metrics add crucial context to the story. Each one reveals a different piece of the puzzle.
- Reach: This is the number of unique individuals who saw your content. It’s your potential audience for a single post.
- Impressions: This is how many times your content was displayed on a screen. One person could see the same post multiple times, so impressions are always higher than reach.
- Share of Voice: This one is a bit more advanced. It tracks how much of the online conversation about your industry or specific keywords features your brand compared to your competitors. It's a great way to measure your authority and brand awareness.
This overview shows how tracking these data points can feed directly back into your content strategy, helping you learn what resonates and build a stronger community.
As you can see, analyzing these metrics isn't just about numbers; it's about getting to know your audience on a deeper level. To make sure your great content is discoverable in the first place, it's smart to build it on a foundation of comprehensive SEO strategies that improve your visibility right from the start.
So, What's a "Good" Number?
Okay, let's talk benchmarks. What's a good engagement rate to aim for? The honest answer is: it depends entirely on the platform.
Engagement rate is a critical client engagement metric because it shows how invested your audience is. Based on recent data, LinkedIn is the king of B2B engagement, with an average rate of around 3-3.5%. Instagram comes in next with a respectable 0.45-0.6%, followed by Facebook at 0.06-0.20%, and X (formerly Twitter) trailing slightly at 0.04-0.15%.
A quick word of advice: don't get too hung up on these industry-wide numbers. They’re helpful as a starting point, but your real goal should be to beat your own numbers, month after month.
Watching these metrics will show you where your time is best spent. Is your LinkedIn engagement through the roof? Great, lean into that. Is your Facebook performance a little lackluster? It might be a signal to adjust your content mix for that audience.
For a deeper look into the nitty-gritty, check out our complete guide on the topic: https://www.evergreenfeed.com/blog/social-media-engagement-metrics/. When you pay attention to these numbers, you stop guessing and start making smart, data-backed decisions that turn your social media channels into genuine community-building machines.
Measuring What Happens After The Click
A like or a share is a nice pat on the back, but the real story begins with client engagement metrics. These numbers tell you what actually happens after someone clicks a link in your social media post. They took the bait—now, does your content deliver on its promise?
Think of your content as a physical store. A sharp social media post is the flashy window display that convinces someone to step inside. But what happens then? Do they take one look, turn around, and walk right back out? Or do they start exploring the aisles, genuinely interested in what you have to offer?
That's precisely what post-click metrics reveal. They show you just how good your content is at keeping the attention it just earned.

Key Metrics for Content Performance
To get a clear picture of your content's performance, you really only need to focus on three core metrics. Each one tells a different part of the engagement story.
- Click-Through Rate (CTR): This is the percentage of people who saw your post and actually clicked the link. It’s a direct measure of how compelling your headline, image, and copy were. A high CTR means your "window display" is doing its job.
- Time on Page: This tells you exactly how long people stick around once they land on your content. The longer they stay, the more valuable and engaging they find it—just like a shopper who spends time browsing every aisle in your store.
- Bounce Rate: This is the percentage of visitors who land on your page and leave without doing anything else, like clicking another link. A high bounce rate is the digital equivalent of someone popping their head in the door, saying "nope," and leaving immediately.
A low CTR isn't just a social media problem; it's a content problem. It signals a disconnect between what your audience expects from your post and what your content actually delivers, telling you it's time to realign your messaging.
Understanding how these numbers relate is where the magic happens. A high CTR paired with a high bounce rate means your hook was fantastic, but the content fell flat. On the flip side, a low CTR but a great time on page for the few who do click suggests your content is solid, but your social media promotion needs a serious boost. For a wider perspective on audience interaction, you can also look into newsletter engagement metrics to see how people connect with your brand in their inbox.
How to Calculate and Interpret These Metrics
The math here is simple, but the insights are powerful. Here’s a quick breakdown.
Click-Through Rate (CTR)
- Formula: (Total Clicks / Total Impressions) x 100
- Interpretation: While anything over 1-2% is often seen as a decent benchmark, what really matters is improving your own average. Test different headlines, images, and calls-to-action to see what moves the needle.
Time on Page
- Formula: No math needed—you can find this metric directly in your analytics platform, like Google Analytics.
- Interpretation: Context is everything. If you have a 1,500-word deep-dive article, an average time on page of just 30 seconds is a major red flag. It means people are skimming and leaving, not reading.
Bounce Rate
- Formula: (Single-Page Sessions / Total Sessions) x 100
- Interpretation: A bounce rate over 70% can signal that your content is irrelevant to the visitor or the user experience is poor. A quick fix is to add compelling internal links to related content, giving them a reason to stick around. You can get really granular with tracking by learning more about using UTM variables in Google Analytics.
Gauging Long-Term Audience Loyalty
While clicks and time spent on a page are great for understanding how a single piece of content performs, they don't tell you the whole story. A truly winning content strategy does more than just grab a one-time visitor; it builds a loyal community that genuinely wants to stick around. This is where we need to shift our thinking from fleeting interactions to lasting relationships.
Measuring long-term loyalty is really about figuring out how "sticky" your brand is. Are you creating content so valuable that people make a habit of coming back? Or are they just passing through on their way to something else? The metrics that answer these questions are the key to understanding the real health of your online presence.
Metrics That Measure Lasting Connections
To get a real handle on audience loyalty, we need to look at a few specific indicators. These metrics go beyond a single session and start painting a picture of repeat behavior over time. They show you who your most dedicated fans truly are.
Three metrics really get to the heart of it:
- Customer Retention Rate: This is the big one. It measures the percentage of customers you hold onto over a set period. It's the ultimate sign of satisfaction and loyalty.
- Churn Rate: The flip side of retention, churn tracks the percentage of customers who leave. Think of it as an essential early-warning system for problems you need to fix.
- Repeat Visit Rate: This one is simple but powerful. It shows how many of your website visitors are returning versus new. It’s a direct signal of your content’s ability to build a following.
These loyalty-focused client engagement metrics are your compass for building a sustainable brand. A high retention rate and frequent repeat visits prove your content is not just a resource, but a destination.
Putting It Into Practice
Let's make this real. Imagine you run a blog for your small business and use Instagram to drive traffic. You post a link that sends a huge wave of new visitors to one of your articles. Great! But then you check your analytics and see that almost none of them ever come back.
A few weeks later, another post gets less initial traffic, but the visitors who do click through keep returning week after week.
That's a crystal-clear signal. The second post created a genuine connection and built trust, turning a casual browser into a loyal reader. This insight is pure gold—it tells you exactly what kind of content nurtures an audience and should guide your entire strategy moving forward.
A related concept here is Reach, which simply measures how many unique people see your content in the first place. Reach sets the stage for every other interaction. To give you some context, recent benchmarks for large brands on Instagram show a solid reach rate is about 8% for posts and 1% for Stories. Meanwhile, engagement by reach on Facebook tends to top out around 1.20%.
These numbers show how effective a platform like Instagram can be for getting in front of new people who could become your next loyal followers. You can discover more insights about engagement metrics on sfpractice.telusdigital.com. By keeping a close eye on who you're reaching and how many of them come back, you can measure the true, long-term impact of your work.
How To Improve Your Metrics With Smart Automation

Knowing your client engagement metrics is the first step. Actually improving them, consistently, is a whole different ballgame. The secret isn't about grinding harder—it's about working smarter with the right automation. This is where tools like EvergreenFeed and Buffer come in, helping you turn a manual, time-consuming task into a reliable, high-impact system.
This isn't about spamming your followers with robotic, impersonal posts. Not at all. Smart automation is about making sure your best content—the stuff that truly resonates—gets the consistent visibility it deserves. It frees you from the daily scramble of scheduling, giving you more time to focus on creating the next piece of content your audience will love.
The idea is refreshingly simple: find your greatest hits—the content that already drives clicks and sparks conversations—and put them on a recurring schedule. Doing this creates a steady stream of valuable content for your followers, which solidifies your brand's expertise and keeps engagement high, even when you're busy with other things.
Building Your Automated Engagement Engine
The process is more straightforward than you might think. By pairing content categorization with a smart scheduler, you can build an engine that practically runs itself. This approach doesn't just save you hours of work; it ensures your social media feeds never go dark.
Here’s a simple, four-step process to get it up and running:
- Identify Your Top Performers: First, dig into your analytics. Find the blog posts, videos, or guides that have historically performed the best. Look for the highest click-through rates, the most comments, and the longest time on page. These are your evergreen assets.
- Organize Content into Categories: Next, group that evergreen content into logical buckets inside a tool like EvergreenFeed. You might create categories like "How-To Guides," "Industry Insights," "Customer Stories," or "Quick Tips."
- Set Your Optimal Schedule: Connect EvergreenFeed to your Buffer account. From there, you can build a unique posting schedule for each social media profile, assigning different content categories to specific days and times.
- Let the System Work: Once it's all set up, the tools take over. EvergreenFeed will pull a post from the right category and add it to your Buffer queue, guaranteeing a varied and consistent flow of content without you having to lift a finger.
Visualizing Your Content Automation Flow
To see what this looks like in practice, here is a typical content categorization setup inside EvergreenFeed.
This dashboard shows how you can organize different content types—from blog posts to promotions—into separate buckets, each with its own schedule. It’s this level of organization that makes it possible to automatically deliver a balanced and engaging content mix.
By automating the distribution of your best work, you multiply its impact. A single high-performing article can drive engagement for months or even years, continuously attracting new audience members and reinforcing your message without any extra effort on your part.
This strategic approach does more than just fill your social calendar. It ensures that every post you share is a proven winner, maximizing your chances of boosting those key client engagement metrics. You can dive deeper by exploring these marketing automation best practices to fine-tune your strategy. Ultimately, this frees you up to analyze what's working and focus on creating your next wave of amazing content.
Got Questions About Engagement Metrics? Let's Get Them Answered.
Once you have the formulas and strategies down, the real questions start to pop up. How does all this theory actually play out in a busy work week? It's one thing to know the definitions, but another to apply them confidently.
Let's walk through some of the most common questions I hear from marketers. Think of this as the practical part of the guide—just straight answers to help you turn these numbers into real-world results.
What’s a “Good” Engagement Rate, Really?
This is probably the number one question, and the honest answer is: it depends. What's considered "good" changes wildly from one social media platform to another, so context is everything.
That said, having some benchmarks helps you know where you stand. On a professional platform like LinkedIn, anything over 2% is great. For a visual-heavy feed like Instagram, you're doing well if you hit above 1%. And on Facebook, a solid rate is anything over 0.5%.
But here’s the most important thing to remember: the goal isn’t to hit some universal magic number. It's about beating your own baseline. Use industry averages as a compass, but measure your success by your own progress over time.
How Often Should I Be Checking My Metrics?
It's so easy to get addicted to hitting refresh on your analytics dashboard, but that's a recipe for making knee-jerk decisions based on tiny, meaningless fluctuations. A steady, consistent rhythm is always better.
I recommend a weekly check-in. It's the perfect cadence to spot trends as they’re forming without getting bogged down in the daily noise. This gives you just enough data to see what’s resonating and make small, smart tweaks.
Then, block out time for a deeper dive monthly or quarterly. This is where you do your strategic thinking. Look at your best-performing content, fine-tune your content categories in EvergreenFeed, and make bigger adjustments to your overall content plan for the months ahead.
Wait, Can High Engagement Actually Hurt Sales?
You bet it can. This is a classic trap: your content is entertaining, gets tons of likes and shares, but does absolutely nothing for your bottom line. That viral meme you posted might get you thousands of reactions, but if it doesn't attract people who are actually interested in what you sell, it's just a vanity metric.
To sidestep this, you need to look at the whole picture. It’s about tracking a balanced diet of metrics.
- Keep an eye on top-of-funnel engagement (likes, shares) to see how far your brand's voice is traveling.
- But you must also track bottom-of-funnel metrics like your Click-Through Rate (CTR) and, ultimately, your conversions.
A winning strategy doesn't just get people talking; it guides the right people toward the solutions you provide.
If I Had to Pick One Metric, Which Is Most Important?
This is a trick question, because there isn't one. The "most important" metric is whichever one aligns directly with the goal of a specific post or campaign. Instead of searching for a single silver bullet, get into the habit of tying a primary metric to every objective.
Here’s how that looks in practice:
- Goal: Brand Awareness? Your focus should be on Reach and Impressions. How many eyeballs saw your content?
- Goal: Community Building? You’ll want to prioritize Engagement Rate, with a special focus on comments and conversations.
- Goal: Driving Website Traffic? Your north star is Click-Through Rate (CTR). It’s a direct measure of how many people are taking the next step with you.
A truly effective strategy assigns a primary metric to each goal while keeping an eye on the others for context. This ensures every single piece of content you create has a clear, measurable job to do.
Ready to stop guessing and start growing? With EvergreenFeed, you can automate the distribution of your best content, ensuring it consistently reaches your audience and boosts your engagement metrics. Start your free trial today and see the difference.